
|
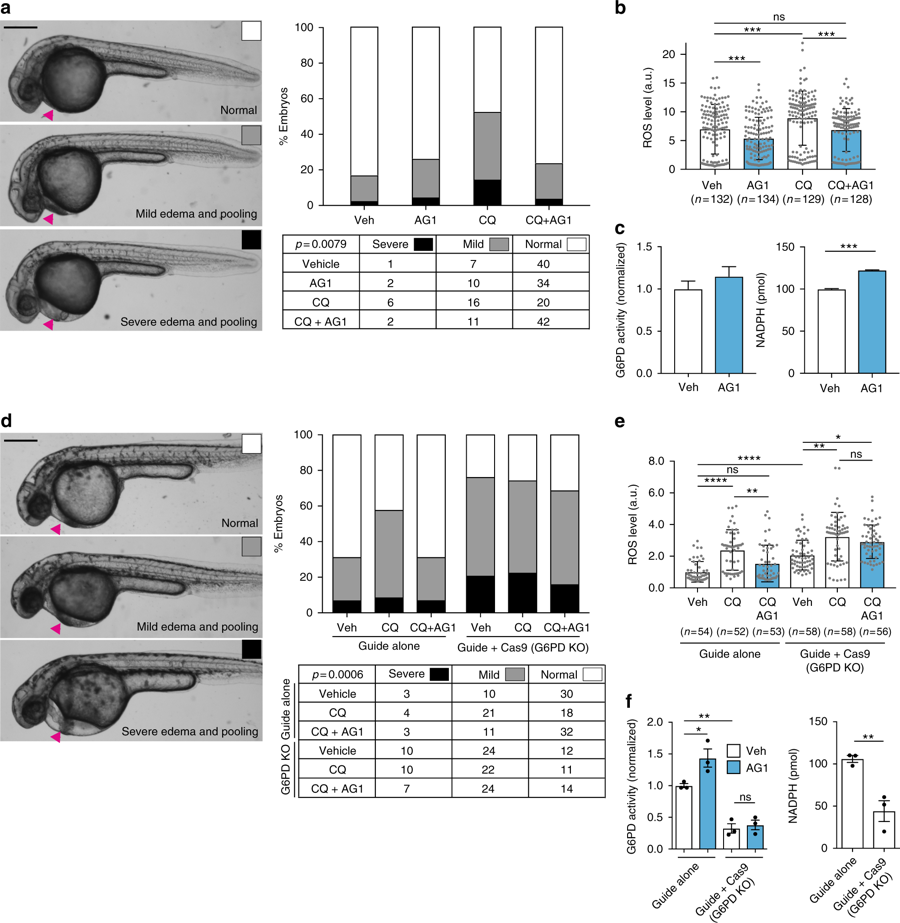
Fig. 4
AG1 attenuates ROS-induced pericardial edema in a G6PD-dependent manner. a Embryos were treated at 24 hpf with 1??M AG1 with and without chloroquine (CQ; 100??g?mL?1) and scored at 32 hpf. Representative phenotypic images of pericardial edema and pooling (magenta arrows) are provided on the left (scale bar: 300??m). Embryo orientation is lateral view, anterior left. Raw counts used for chi-square analysis and calculated p value are included in table below. b ROS levels in individual WT embryos from three independent clutches. Embryos were treated at 24 hpf for 5?h before ROS measurement. Error bars represent mean?�?SD (***p?<?0.001, ns?=?not statistically significant, p?>?0.99, Kruskal?Wallis multiple comparison test, adjusted p value using Dunn?s test). c G6PD activity and NADPH levels were measured using the lysates of pooled embryos (from two independent clutches). Error bars represent mean?�?SEM (***p?=?0.0003, two-tailed unpaired Student?s t-test). d Embryos were injected with either sgRNA targeting exon 10 of g6pd (Guide alone) or sgRNA?+?Cas9 protein (Guide?+?Cas9, G6PD KO (knockout)) to generate G6PD F0 crispants. Representative phenotypic images of pericardial edema and pooling (magenta arrows) are provided on the left (scale bar: 300??m). Treatment conditions are the same as in a. Raw counts used for chi-square analysis and calculated p value are included in table below. e ROS levels in individual embryos with sgRNA or sgRNA?+?Cas9 (G6PD KO) protein injection. Treatment conditions and the statistics are the same as in b (*p?=?0.0267, **p?<?0.01, ****p?<?0.0001, ns?=?not statistically significant). f G6PD activity and NADPH levels were measured with lysates of pooled embryos from three independent experiments. Error bars represent mean?�?SEM of the replicate measurements (*p?<?0.05, **p?<?0.01, one-way ANOVA for G6PD activity measurement and two-tailed unpaired Student?s t-test for NADPH measurement). Veh: vehicle, KO: knockout, CQ: chloroquine