
|
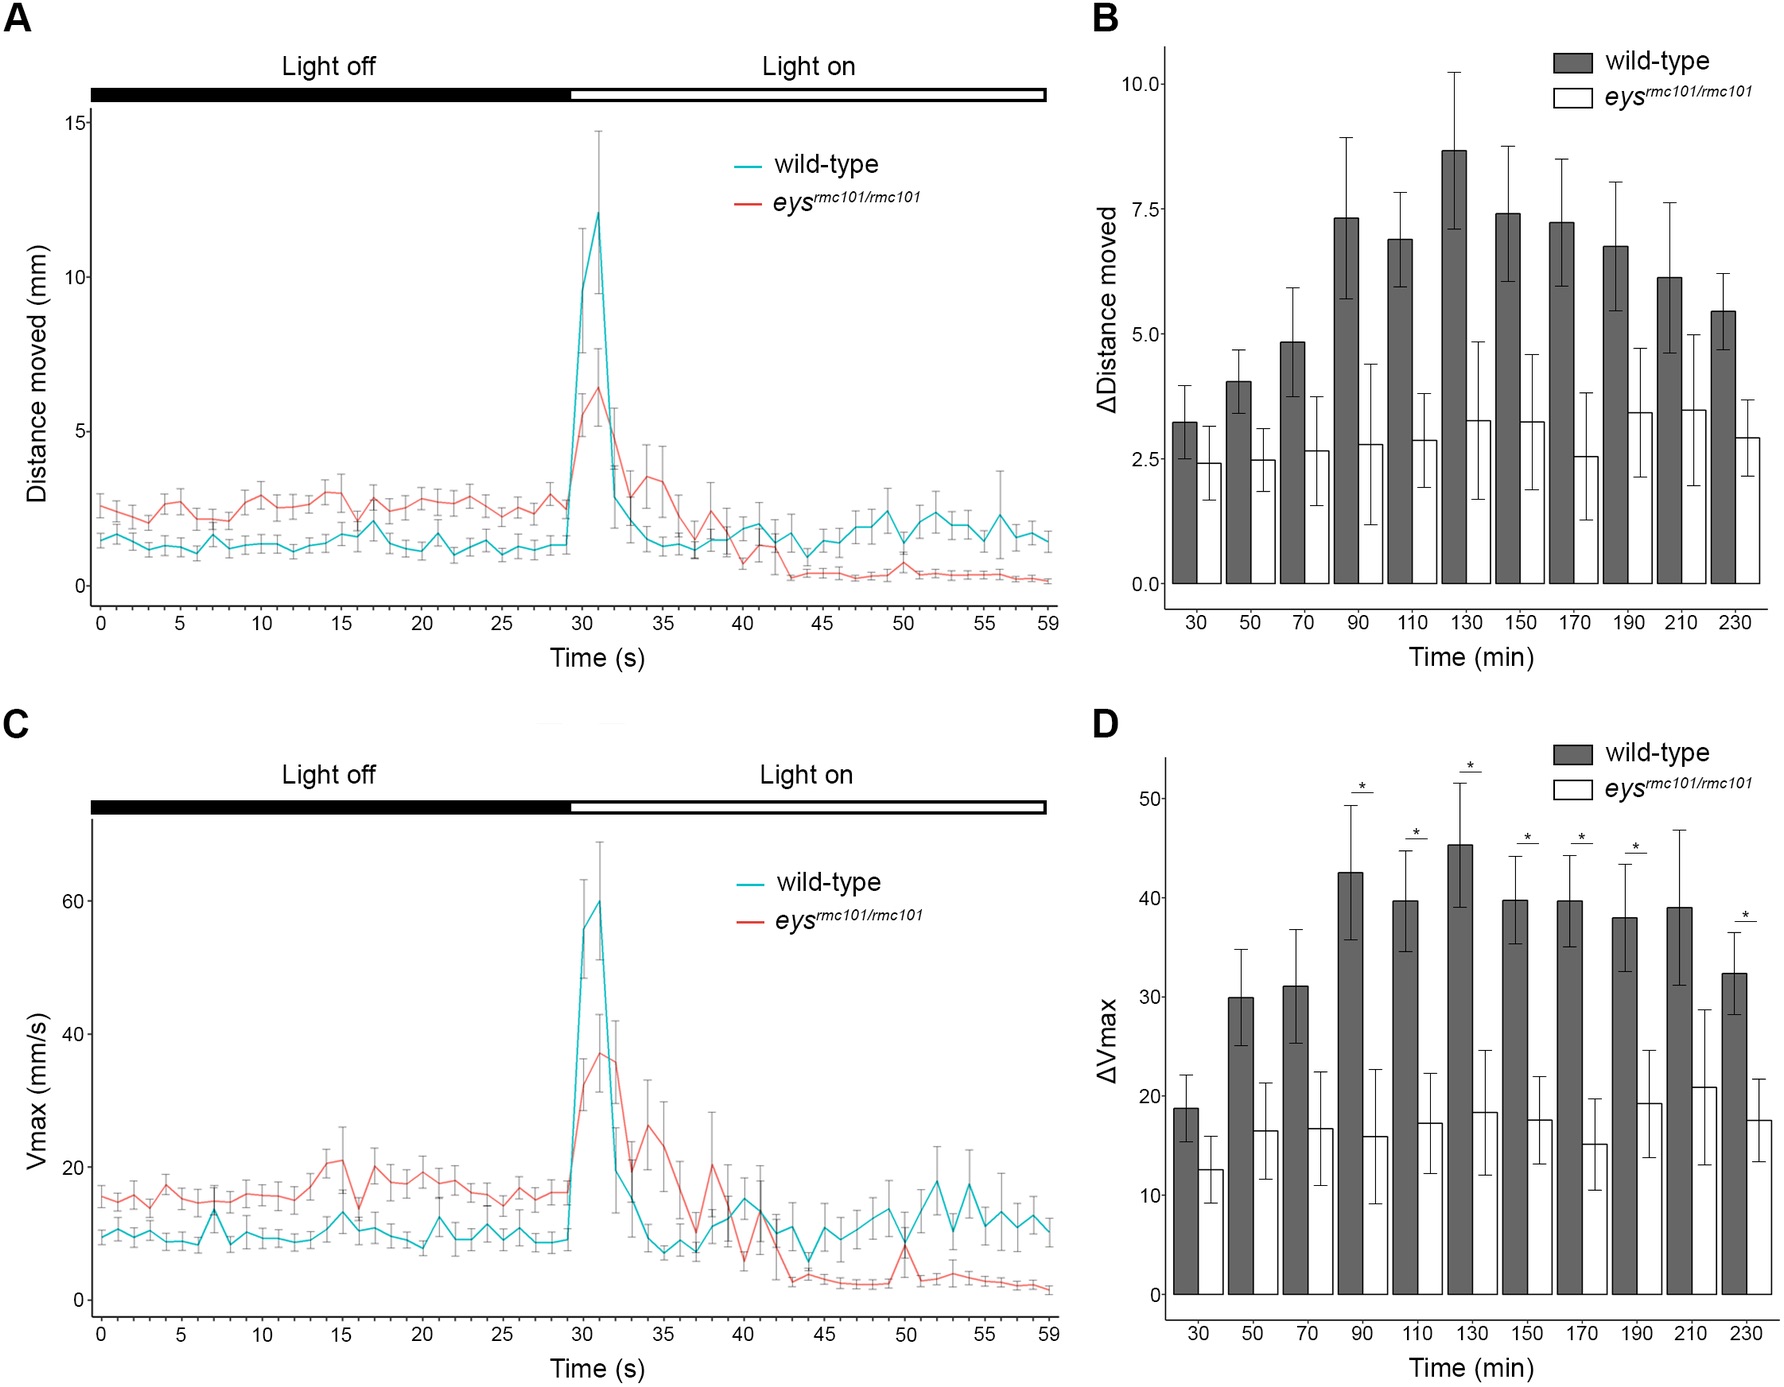
Fig. 4
Visual motor response of zebrafish larvae.
(A) Distance moved (mm) of wild-type (blue line) and eysrmc101/rmc101 (red line) larvae in response to a light stimulus (dark-to-light transition at t = 50 minutes). (B) Comparison of difference in distance moved between wild-type and eysrmc101/rmc101 larvae at the dark to light transition zones. (C) Maximum velocity (Vmax; mm/s) of wild-type (blue line) and eysrmc101/rmc101 (red line) larvae in response to a light stimulus (dark-to-light transition at t = 50 minutes). (D) Comparison of difference in Vmax between wild-type and eysrmc101/rmc101 larvae at the dark to light transition zones. All experiments were done with larvae at 5 dpf (n = 120). Statistical significance (p<0.05) is indicated with an asterisk.