
|
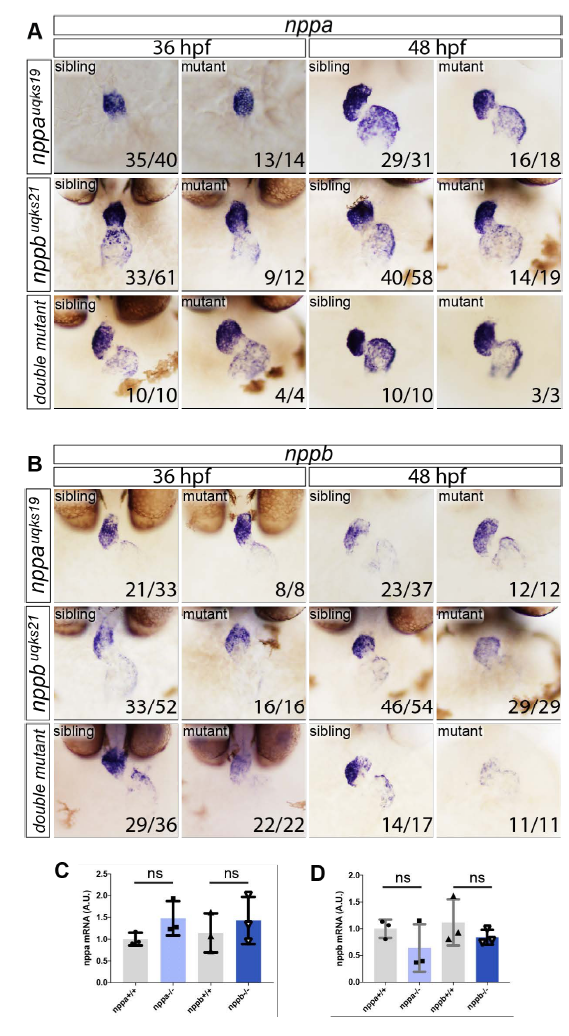
Fig. S1
ISH expression analysis of nppa and nppb in siblings, single nppa and nppb mutants and double mutants. Expanded expression analysis from that represented in Figure 1C, showing A. nppa and B. nppb expression at 36 and 48 hpf. No gross differences in either morphology or expression levels are observed for any of the scenarios, with the exception that nppb expression in nppb mutants (or double mutants) has reduced staining by ISH. C. Q-PCR analysis of nppa expression levels in nppa single mutants compared with in-clutch sibling controls or nppb single mutants compared with siblings. No significant difference in expression is observed (ns). D. Q-PCR analysis of nppb expression on nppa and nppb single mutants compared with sibling controls showing no significant difference (ns) between groups. Twotailed t-test on n=3 replicates, where each replicate contained pooled mRNA from 4 genotyped embryos.