Fig. 2
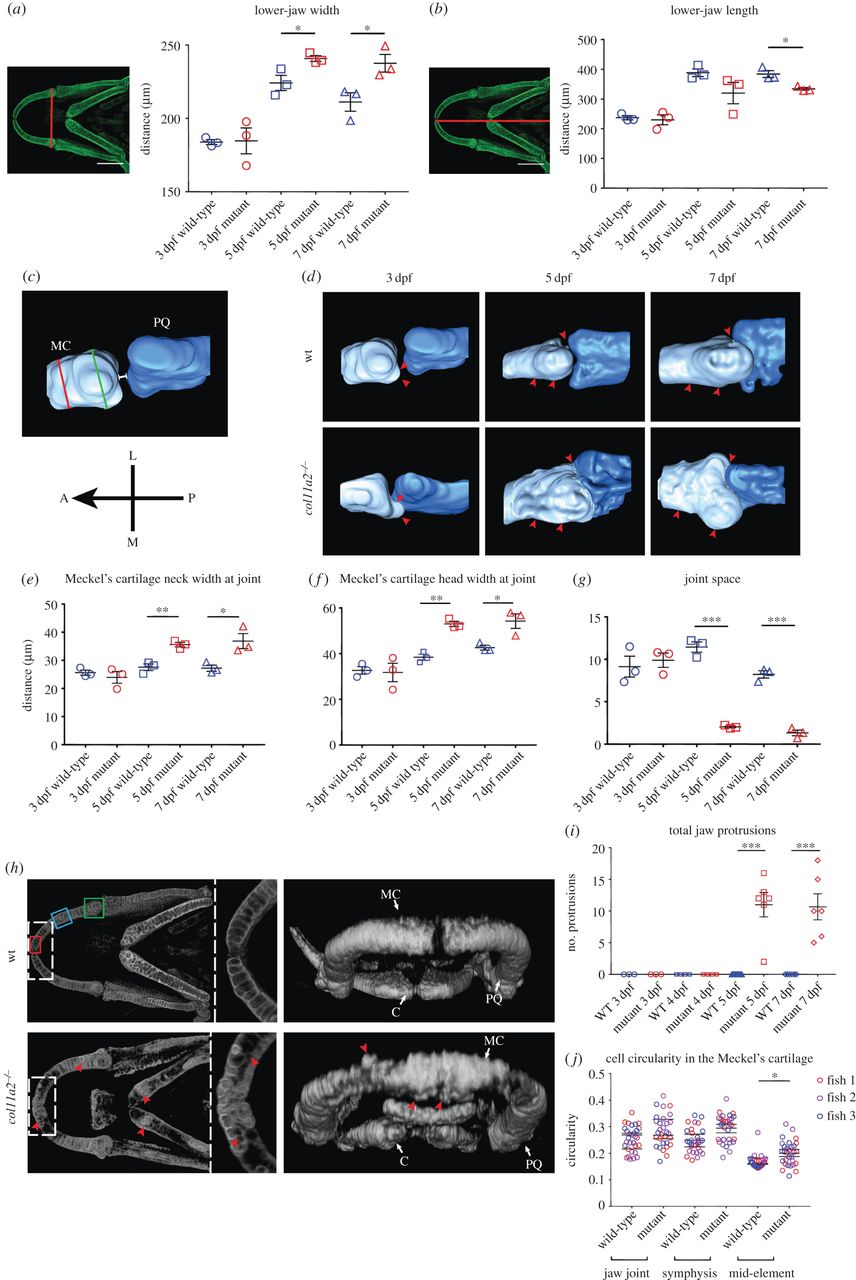
col11a2 mutant zebrafish develop altered morphology and joint spacing in the lower jaw. (a,b) Lower-jaw shape quantification (n = 3 for all), location of measurements shown to the left of graphs. (c) Representation of measurements taken of joint neck (red line), joint head (green line) and joint space (white line) (Meckel's cartilage, light blue; palatoquadrate, dark blue). Orientation compass: A, anterior; L, lateral; M, medial; P, posterior. (d) Three-dimensional surface renders of jaw joint from confocal images of wt and col11a2?/? at 3, 5 and 7 dpf. Red arrowheads, areas of change. (e?g) Quantification of joint morphology at the Meckel's cartilage neck at joint (e), Meckel's cartilage head at joint (f) and joint space (g) (n = 3 for all). (h) Three-dimensional volume renders of wt and col11a2?/? zebrafish at 7 dpf. Dashed insets show Meckel's symphysis at higher magnification (red arrowheads, protruding cells). (i) Quantification of protruding cells in wt and col11a2?/? zebrafish at 3?7 dpf (n = 3, 3, 4, 4, 13, 6, 8, 6). (j) Quantification of cell circularity in the Meckel's cartilage in 5 dpf wt and col11a2?/? fish (n = 3 for all). Location of measurements shown in h (red box, Meckel's symphysis; blue box, mid-element; green box, jaw joint). Student's unpaired t-tests performed in a, b, e?g, i and j: data are mean with SEM (j shows mean with no SEM, t-tests performed between mean values). *p ? 0.05, **p ? 0.01, ***p ? 0.001.

