
|
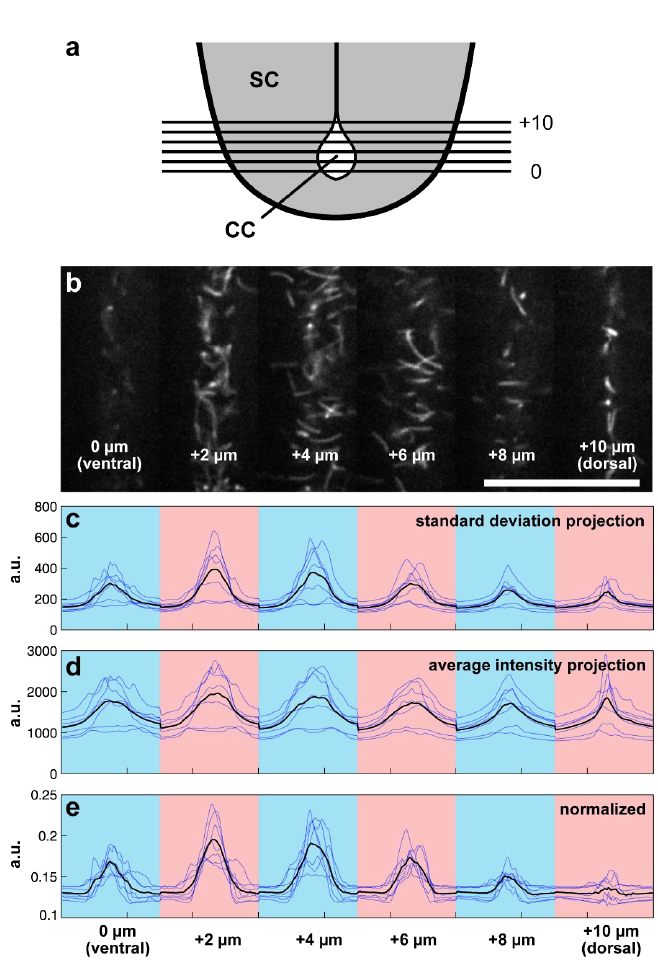
Fig. S1
Estimation of wild type ciliary motion as a function of position in the dorsoventral axis.
(a) Schematic illustrating ciliary imaging experiments. Time-lapses are taken from optical slices covering the central canal moving ventral to dorsal 2 ?m apart. (b) Representative frame from a conjoined time-lapse showing 6 planes of central canal cilia. Scale: 25 ?m. (c) Intensity plot profiles derived from standard deviation projections. Blue traces are individual embryos, black trace represents average across all embryos. Blue and pink coloration defines the optical section. (d) Intensity plot profiles derived from average intensity projections. (e) Normalized profiles generated by dividing individual standard deviation profile plots by average intensity profile plots reveal a greater motility 2 - 4 ?m away from the ventral boarder of the central canal. a.u. = arbitrary units.