
|
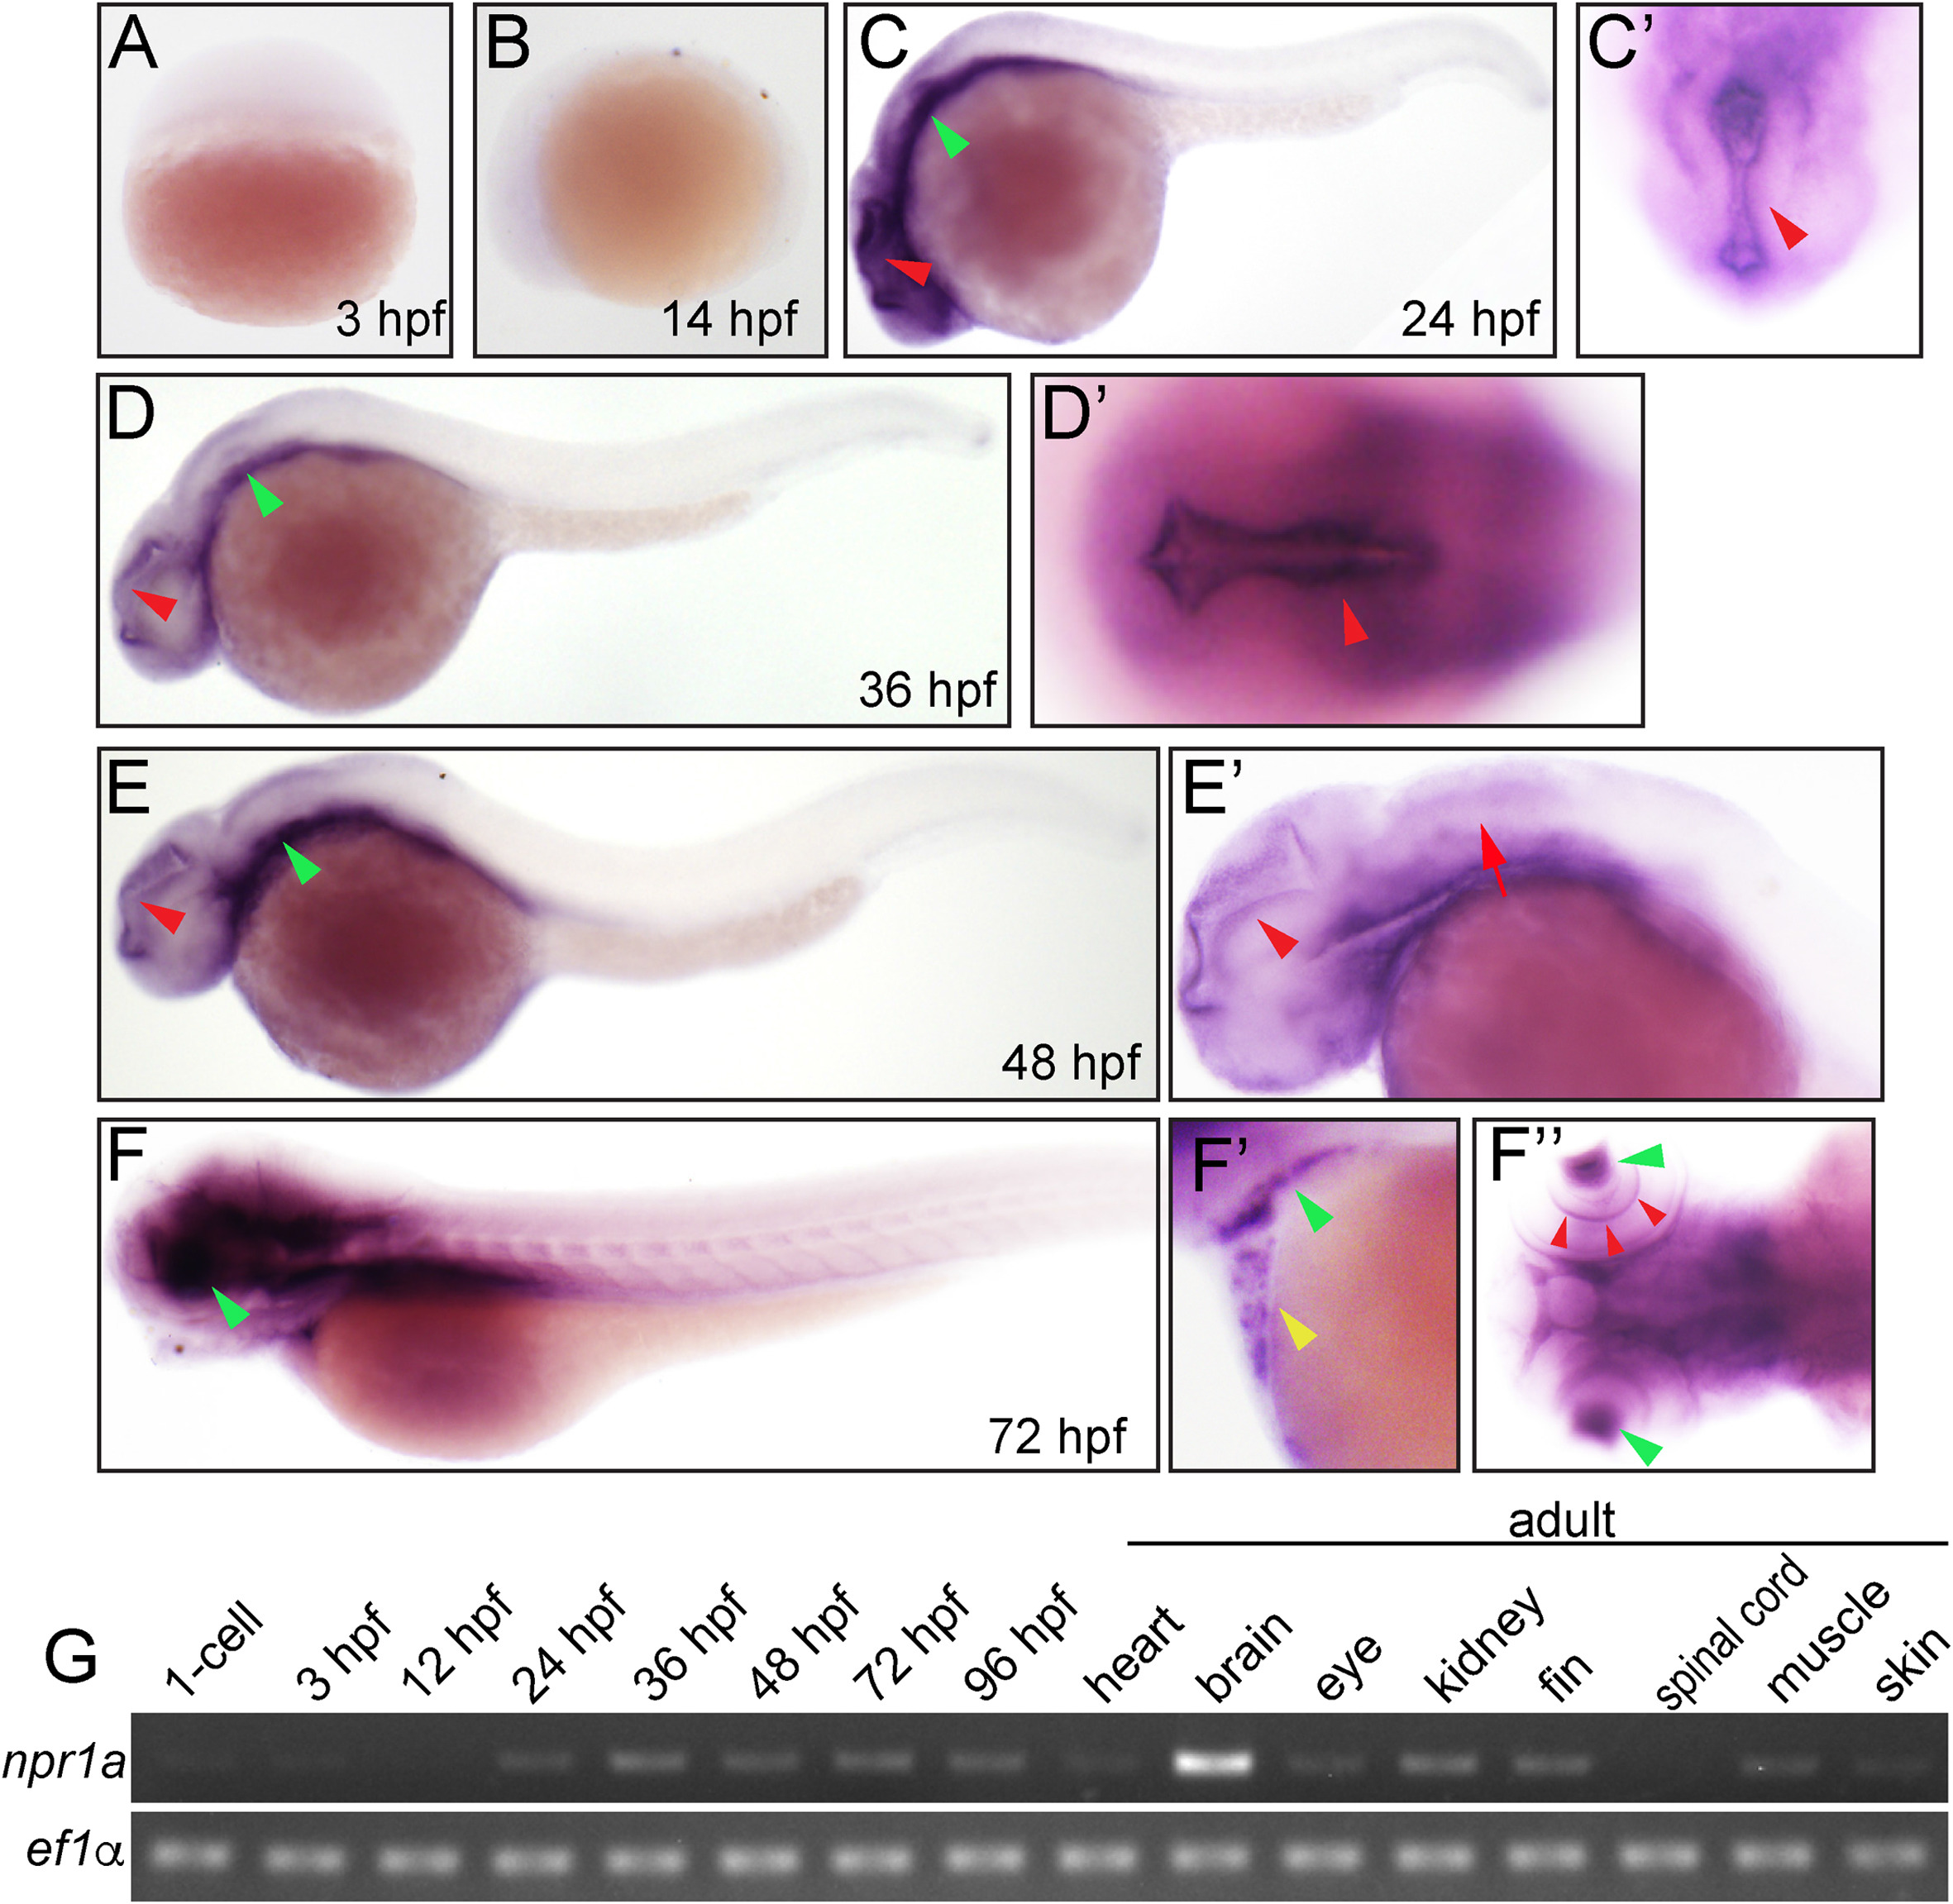
Fig. 2
Expression analysis of zebrafish npr1a. (A) 3 hpf, lateral view, no staining. (B) 14 hpf, lateral view, weak staining. (C) 24 hpf, lateral view, red arrowhead indicates tectal ventricle; green arrowhead indicates pharyngeal arches. (C?) 24hpf, dorsal view, arrowhead indicates tectal ventricle. (D) 36 hpf, lateral view, red arrowhead indicates tectal ventricle; green arrowhead indicates pharyngeal arches. (D?) 36 hpf, dorsal view, arrowhead indicates tectal ventricle. (E) 48 hpf, lateral view, red arrowhead indicates tectal ventricle; green arrowhead indicates pharyngeal arches. (E?) 48 hpf, lateral view, arrowhead indicates tectal ventricle; arrow indicates hindbrain. (F) 72 hpf, lateral view; green arrowhead indicates lens. (F?) 72 hpf, lateral view, yellow arrowhead indicates heart, green arrowhead indicates pharyngeal arche. (F?) 72 hpf, dorsal view, green arrowheads indicate lens; red arrowheads indicate retina (ganglion cell layer). (G) Reverse transcriptase-PCR analysis of zebrafish npr1a.
Reprinted from Gene expression patterns : GEP, 29, Gong, J., Chai, L., Xu, G., Ni, Y., Liu, D., The expression of natriuretic peptide receptors in developing zebrafish embryos, 65-71, Copyright (2018) with permission from Elsevier. Full text @ Gene Expr. Patterns