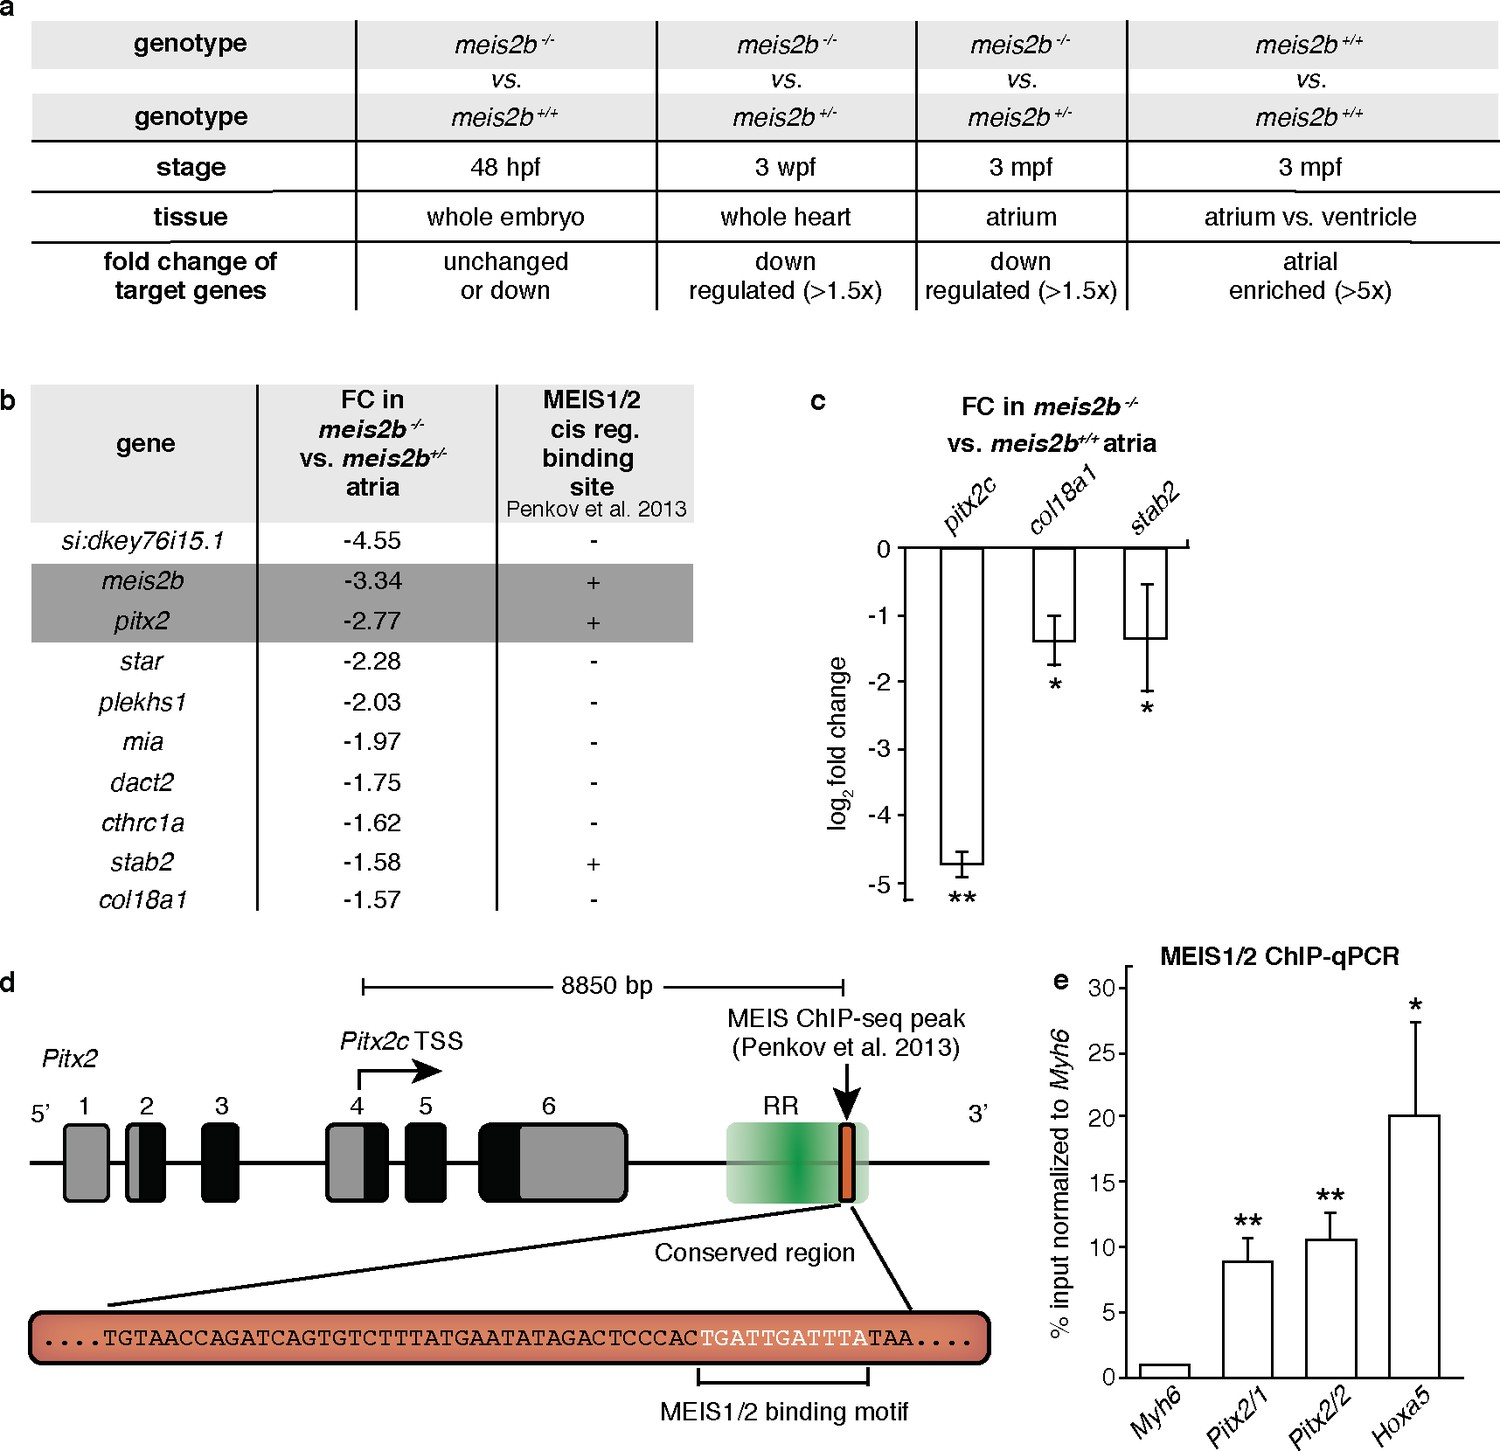
Fig. 7 Meis2b positively regulates cardiac pitx2c expression. (a) Overview of the different samples used for microarray comparison, showing the stage, type of tissue and genotype of the compared samples. The bottom row shows the expected outcome of downstream genes potentially regulated by Meis2b. (b) Table showing the 10 genes fitting all selection criteria (for genes with n > 1, the values are averaged). Cis-regulatory MEIS1/2 DNA binding sites in orthologous mouse genes were extracted from (Penkov et al., 2013). (+, proximal binding site detected; -, no proximal binding site detected)]. (c) RT-qPCR analysis in meis2b-/- vs WT sibling atria. (d) Representation of the Pitx2 locus in mouse indicating the location of a previously reported MEIS1/2 ChIP-seq peak at the 3? end of the regulatory region (RR) (ENSMUSR00000406450) (Penkov et al., 2013). A 53 bp conserved sequence inside the ChIP-seq peak is shown together with the MEIS1/2 binding motif. (e) ChIP-qPCR analysis on E12 embryonic mouse trunks of MEIS1/2 on the Pitx2 locus shown in (d), on the Hoxa5 locus (a known MEIS1/2 direct target), and on Myh6 locus (used as a negative control). One-tailed student t-tests (c), and one-sample t-tests (e) were performed, significant differences compared with control are indicated (*p<0.05; **p<0.005); error bars indicate ąSD.
Image
Figure Caption
Figure Data
Acknowledgments
This image is the copyrighted work of the attributed author or publisher, and
ZFIN has permission only to display this image to its users.
Additional permissions should be obtained from the applicable author or publisher of the image.
Full text @ Elife

