
Image
|
Figure Caption
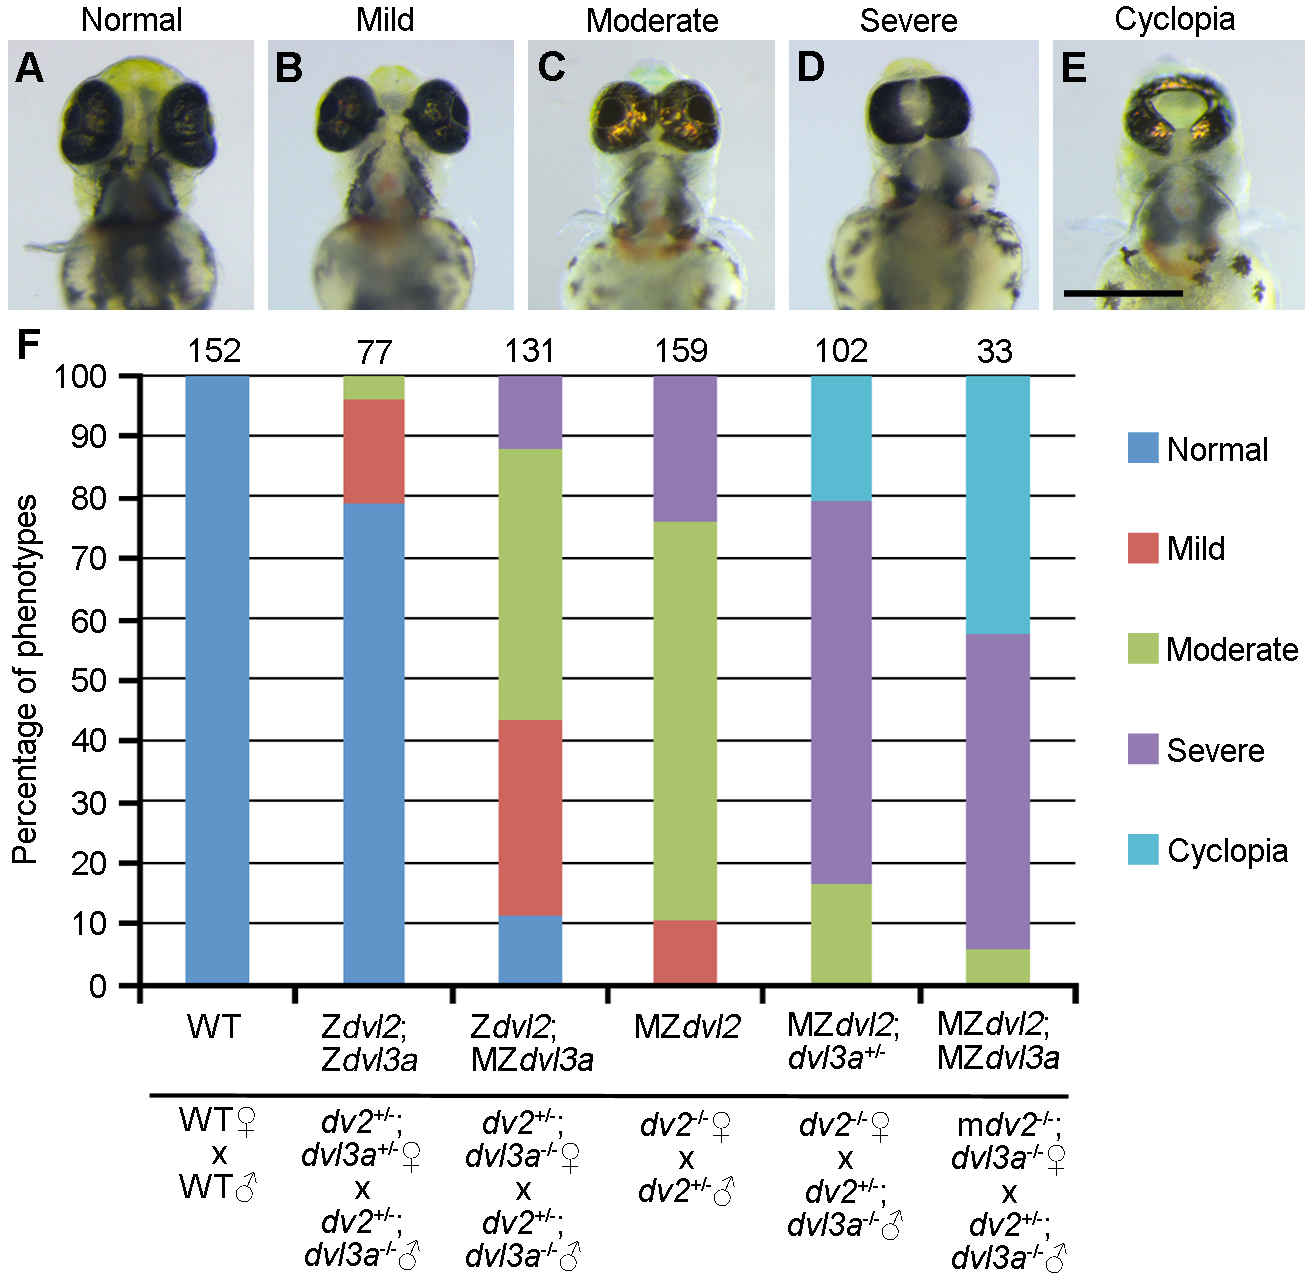
Fig. S12
Development of cyclopia in dvl2 and dvl3a mutants.
(A-E) Ventral view of representative images of normal and different degrees of eye phenotypes at 3 dpf. (F) Quantitative analysis of different degrees of eye phenotypes in indicated mutants. Except for WT embryos, all mutants were analyzed from three independent crosses using the same fish pair (indicated below the horizontal line). Numbers on the top of each column indicate total embryos carrying the indicated genotypes (above the horizontal line). Scale bar: (A-E) 400 ?m.
Acknowledgments
This image is the copyrighted work of the attributed author or publisher, and
ZFIN has permission only to display this image to its users.
Additional permissions should be obtained from the applicable author or publisher of the image.
Full text @ PLoS Genet.