
|
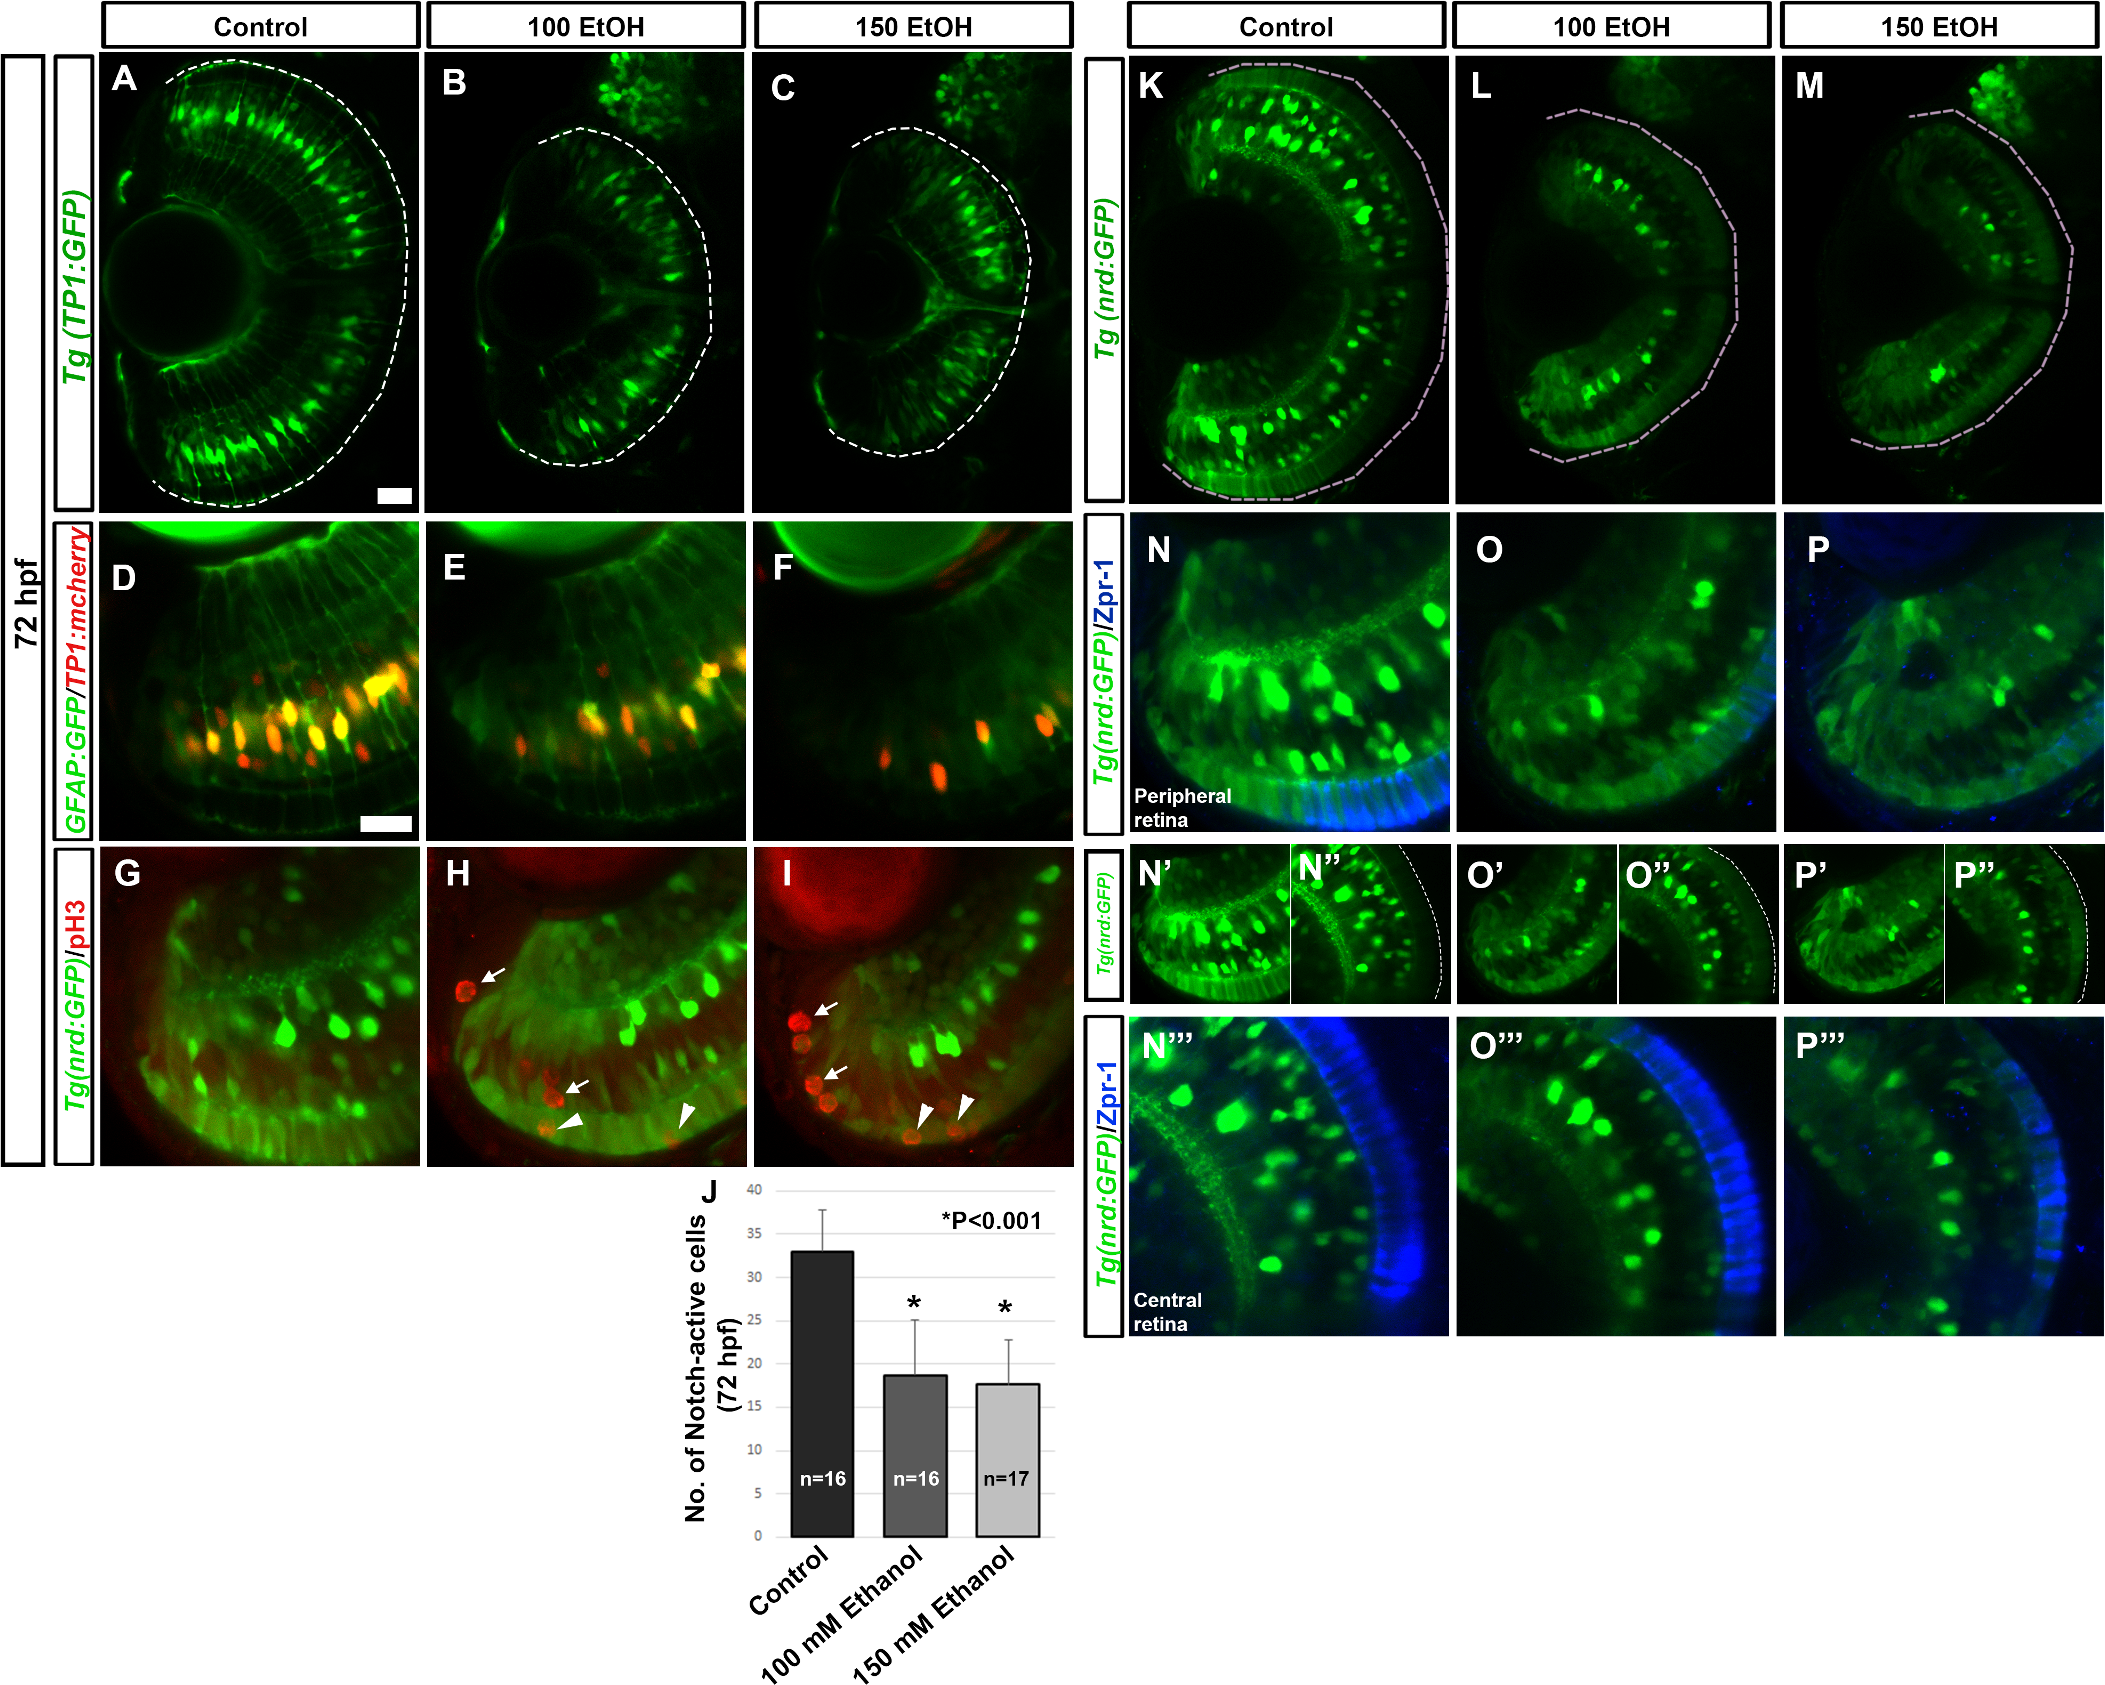
Fig. 3
Effect of ethanol on MGC and central retina precursor cell populations.
(A-C) Transgenic line Tg(TP1:GFP) showed reduced Notch-active cells after ethanol exposure at 72 hpf. (D-F) Double transgenic line Tg(gfap:GFP) and Tg(TP1:mCherry) showed reduced Notch- and GFAP- double positive cells after ethanol exposure at 72 hpf. (G-I) PhosphoH3 immunostaining on Tg(nrd:GFP) larvae showed an increased number of mitotically active cells in the ONL and INL, many of which co-labeled with neurod- positive cells. (J) Quantification of Notch-active cells per optic-nerve containing optical section of the retina using Tg(TP1:mCherry) showed a significant decrease after ethanol treatment in comparison to control fish. A single optic nerve-containing optical section of 72 hpf control and ethanol treated larvae was used. (K-M) Tg(nrd:GFP) larvae showed reduced expression of neurod after ethanol exposure at 72 hpf. (N-P??) zpr-1 immunostaining on Tg(nrd:GFP) larvae showed fewer zpr-1 positive cells in the peripheral retina after ethanol exposure.(N-P). In the central retina, zpr-1-positive cells were double labeled with neurod after ethanol exposure (N??-P??) compared to Tg(nrd:GFP) expression showing expanded neurod expression in the ONL (N?, N?, O?, O?, P?, P?). White dashed lines indicate retinal pigmented epithelium (RPE). Images show rostral at top, lateral at left. Error bars indicate standard deviation. ?*? indicates statistical significance in comparison to control embryos (p<0.05). Scale bar = 20 ?m for panels A-C and K-M. Scale bar = 10 ?m for panels D-P??.