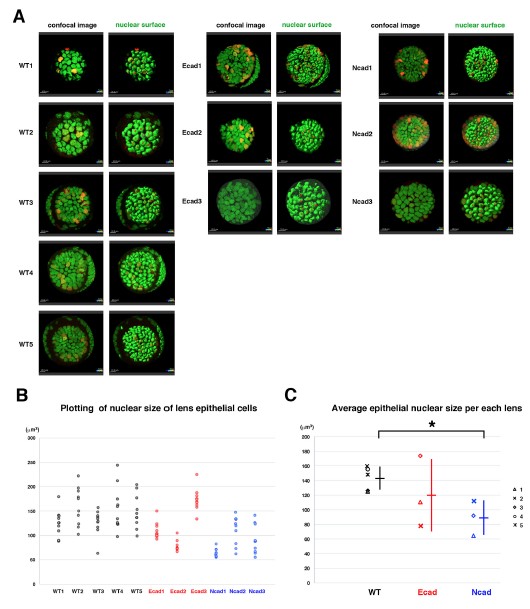
Fig. S9
Analyses of nuclear size of lens epithelial cells
(A) Confocal images (left) and surface objects demarcating lens epithelial nucleus (right) in wild-type, E-cadherin mutant, and N-cadherin morphant anterior lens epithelia at an early stage of the scanned period: 33?36 hpf. Ten lens epithelial cell nuclei randomly selected for measurement of nuclear volume are indicated in red in the right panels.
(B) Plotting of nuclear volumes of individual lens epithelial cells per each of wild-type, E-cadherin mutant, and N-cadherin morphant lenses. Distribution range was variable depending on individual lenses, but the range was reduced in E-cad1, E-cad2 and three N-cad lenses and elevated in E-cad3 lenses, compared with wild-type lenses.
(C) Plotting of average nuclear volumes of lens epithelial cells in each lens. Horizontal bars and vertical lines indicate mean and standard deviation of lens epithelial nuclear volume, respectively. Nuclear size of lens epithelial cells was significantly smaller in the N-cadherin morphant than in wild type, whereas the range was broader in the E-cadherin mutant than in wild type. In the N-cadherin morphant, a reduced tensile force and prominent E-cadherin-dependent cell adhesion may reduce nuclear size. In E-cadherin mutant, the absence of adherens junction may weaken the tensile force transmission from plasma membranes to nuclear membranes, resulting in variable nuclear size. Probability is calculated using Student?s t-text: *p<0.05.

