
|
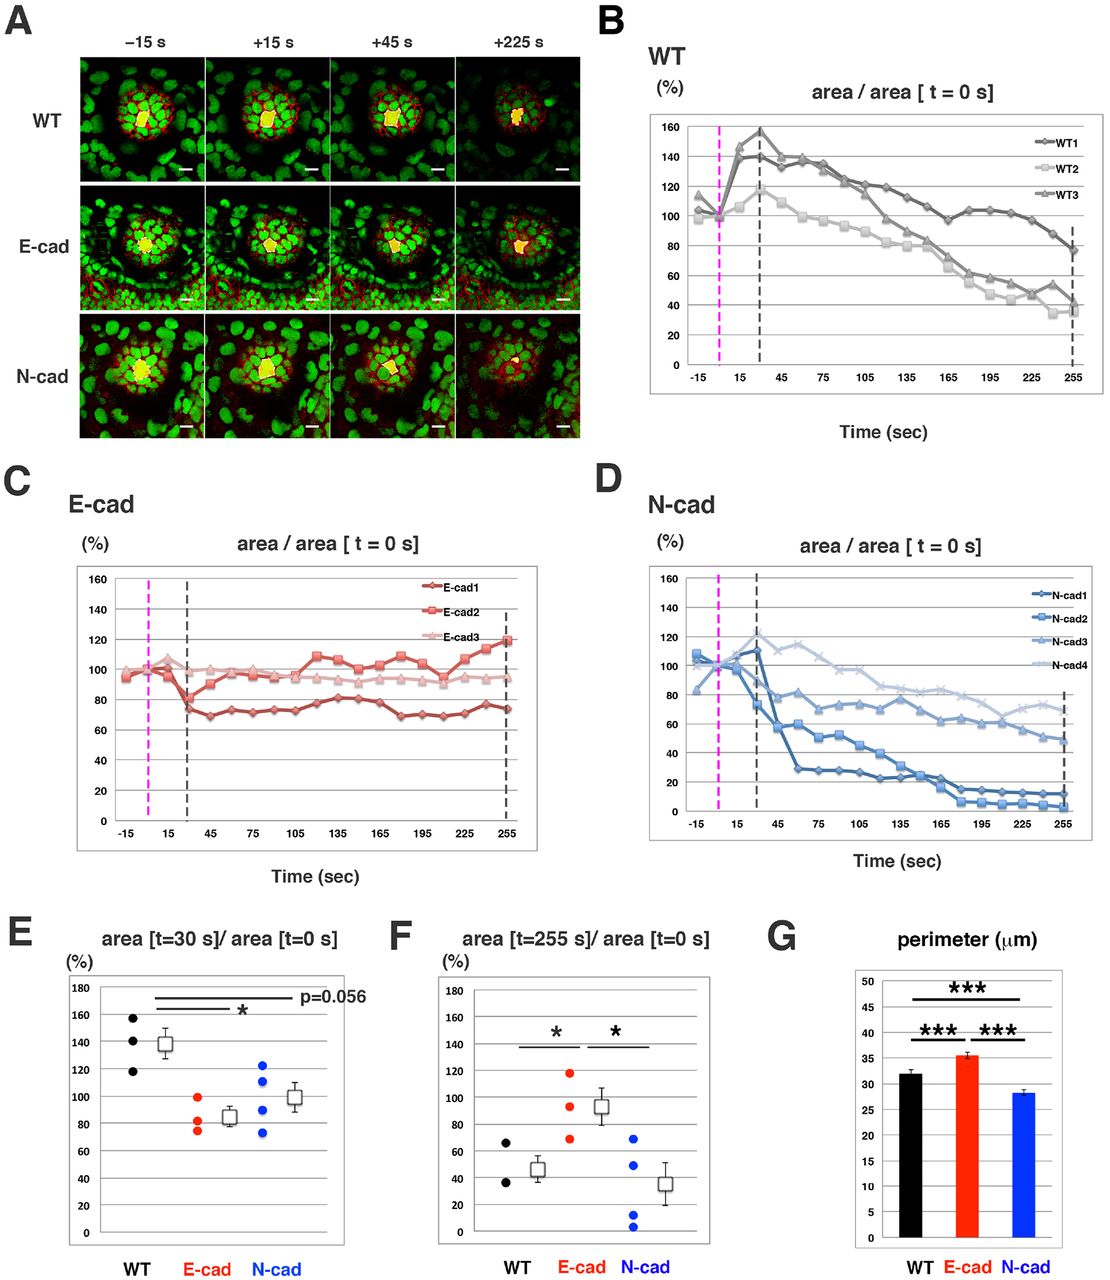
Fig. 5
Laser ablation of lens epithelial cells. (A) Time lapse scanning of 50?hpf wild-type, E-cadherin mutant and N-cadherin morphant lenses. Time indicates the time elapsed after laser ablation. Ablated cells are indicated in green. (B-D) Temporal profile of the ablated area at 50?hpf wild-type (B), E-cadherin mutant (C) and N-cadherin morphant (D) lenses. Ablated areas are normalized by the initial area at t=0 (pink dotted line). Black dotted lines indicate the time when the ablated area reaches its peak in the wild type (t=30) as well as the time at the end of scanning (t=255). (E,F) The ablated area at t=30 (E) and t=255 (F) relative to the initial area at t=0. (G) Perimeter length of wild-type, E-cadherin mutant and N-cadherin morphant lenses at 50?hpf. The error bars indicate the s.e.m. Student's t-test: *P<0.05, ***P<0.005. Scale bars: 10?�m.