Image
Figure Caption
Fig. S2
Analysis of egr2 knockdown embryos
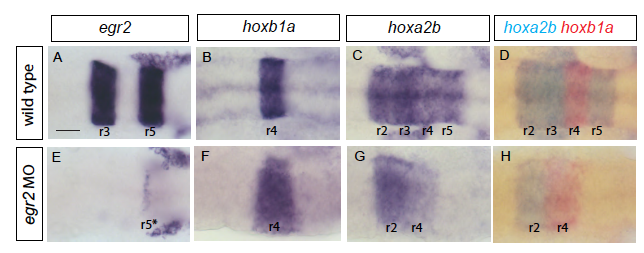
(A-H): Knockdown of egr2a and egr2b results in loss of egr2b expression in r3 and severe reduction of expression in r5* at 17 hpf (E) compared to control embryos (A). Following loss of r3 territory, the flanking segments still express hox genes that mark r2 (hoxa2) and r4 (hoxb1 plus hoxa2): compare controls (B-D) with egr2 knockdown embryos (F-H). A-C and E-G are single in situ hybridizations, and D, H are double in situ hybridizations, as indicated. Scale bar: 50 ?m.
Acknowledgments
This image is the copyrighted work of the attributed author or publisher, and
ZFIN has permission only to display this image to its users.
Additional permissions should be obtained from the applicable author or publisher of the image.
Reprinted from Developmental Cell, 45, Addison, M., Xu, Q., Cayuso, J., Wilkinson, D.G., Cell Identity Switching Regulated by Retinoic Acid Signaling Maintains Homogeneous Segments in the Hindbrain, 606-620.e3, Copyright (2018) with permission from Elsevier. Full text @ Dev. Cell

