
|
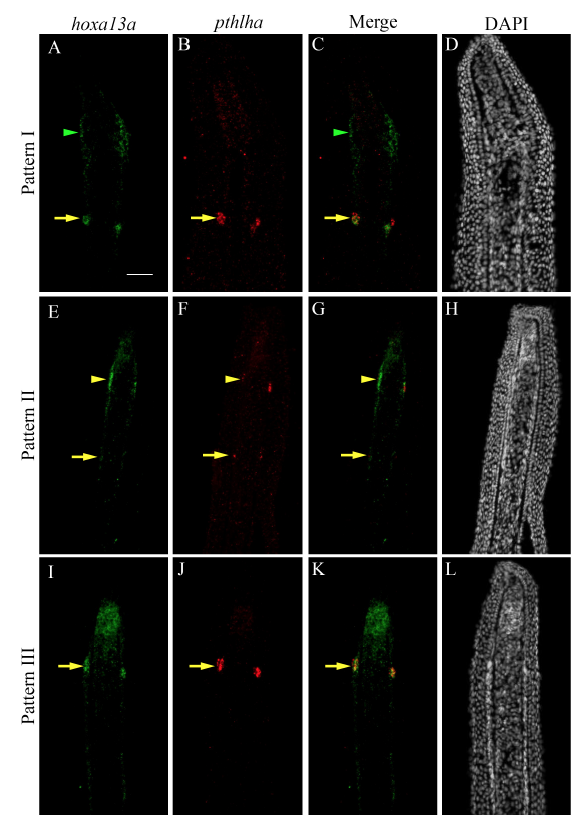
Fig. S5
Relative expression patterns of hoxa13a and pthlha. (A-L) Double FISH (A-C, E-G, I-K) and DAPI counterstains (D, H, L) on longitudinal cryosections of 4 dpa fin regenerates. (AC, E-G, I-K) In joint-forming cells, hoxa13a and pthlha are always co-expressed (yellow arrows). In presumptive joint cells, hoxa13a is expressed either alone (Pattern I: A-D, green arrowheads) or is co-expressed with pthlha (Pattern II: E-H, yellow arrowheads). (I-L) In Pattern III: hoxa13a and pthlha are expressed in joint-forming cells when presumptive cells are not yet present (yellow arrows). (A, E, I) hoxa13a expression alone. (B, F, J) pthlha expression alone. (C, G, K) hoxa13a and pthlha expression merged. Scale Bars = 50?m (shown in A). These images are single image views for the merged images in Fig.4C-C?.