
|
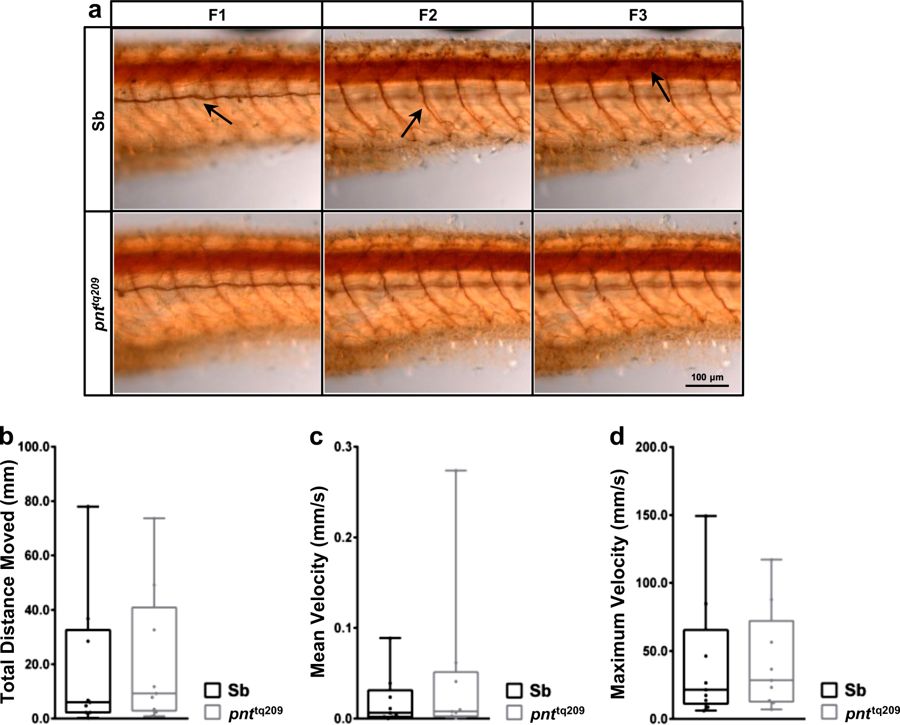
Fig. 4
a Anti-acetylated ?-tubulin IHC of whole-mount 72-hpf zebrafish. No marked differences in axonal growth and morphology were observed between Sb and pnttq209 larvae. Images were acquired at three different focal planes to visualize the lateral line (F1) and the ventral and dorsal motor axons (F2 and F3, respectively). b?d Locomotor activity assay in 72-hpf zebrafish. Total distance moved (b), mean velocity (c) and maximum velocity (d) were measured (average total distance moved (mm), Sb: 18.39?±?8.60, pnttq209: 21.22?±?8.46; average mean velocity (mm/s), Sb: 0.02?±?0.01, pnttq209: 0.05?±?0.03; average maximum velocity (mm/s), Sb: 41.57?±?15.74, pnttq209: 42.47?±?12.62; results are reported as mean?±?S.E.M. (n?=?9)). No variances were observed between Sb and pnttq209 larvae