
|
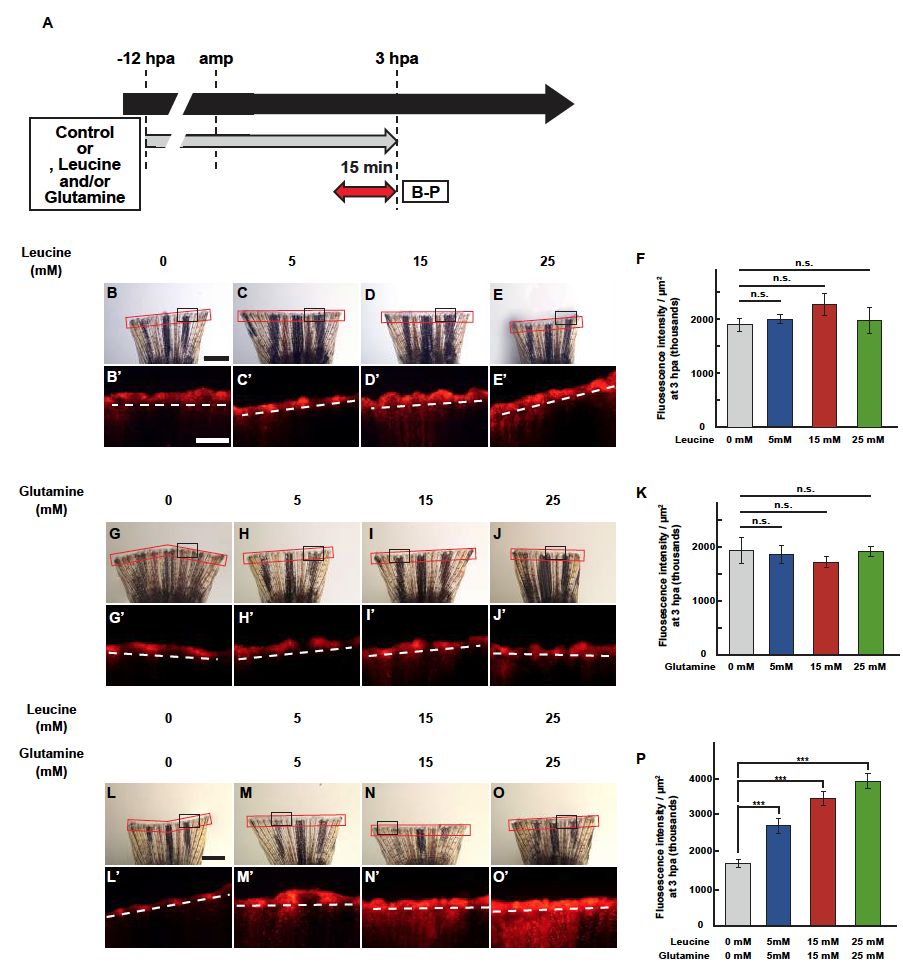
Fig. S9
LG treatment up-regulates lysosomal acidification in a concentration-dependent manner.
(A) Experimental scheme of leucine and/or glutamine treatment from -12 to 3 hpa. A red two-headed-arrow indicates LysoTracker treatment, which was applied 15 min before observation. (B-P) Images of bright-field and fluorescence microscopy, and quantification of LysoTracker fluorescence intensities in fin stumps at 3 hpa (n = 6). Black boxed areas in B-E, G-J, and L-O are enlarged in B?-E?, G?-J?, and L?-O?, respectively. The LysoTracker fluorescence intensities in red boxed area were measured (B-E?, G-J?, and L-O?). Representative images (B-E?, G-J?, and L-O?) used for quantification are shown in F, K, and P. White dashed lines indicate the amputation planes. Scale bars: 1 mm (B-E, G-J, and L-O) and 500�m (B?-E?, G?-J?, and L?-O?). ***p < 0.001 by Student?s t test. Error bars represent the standard error.