
|
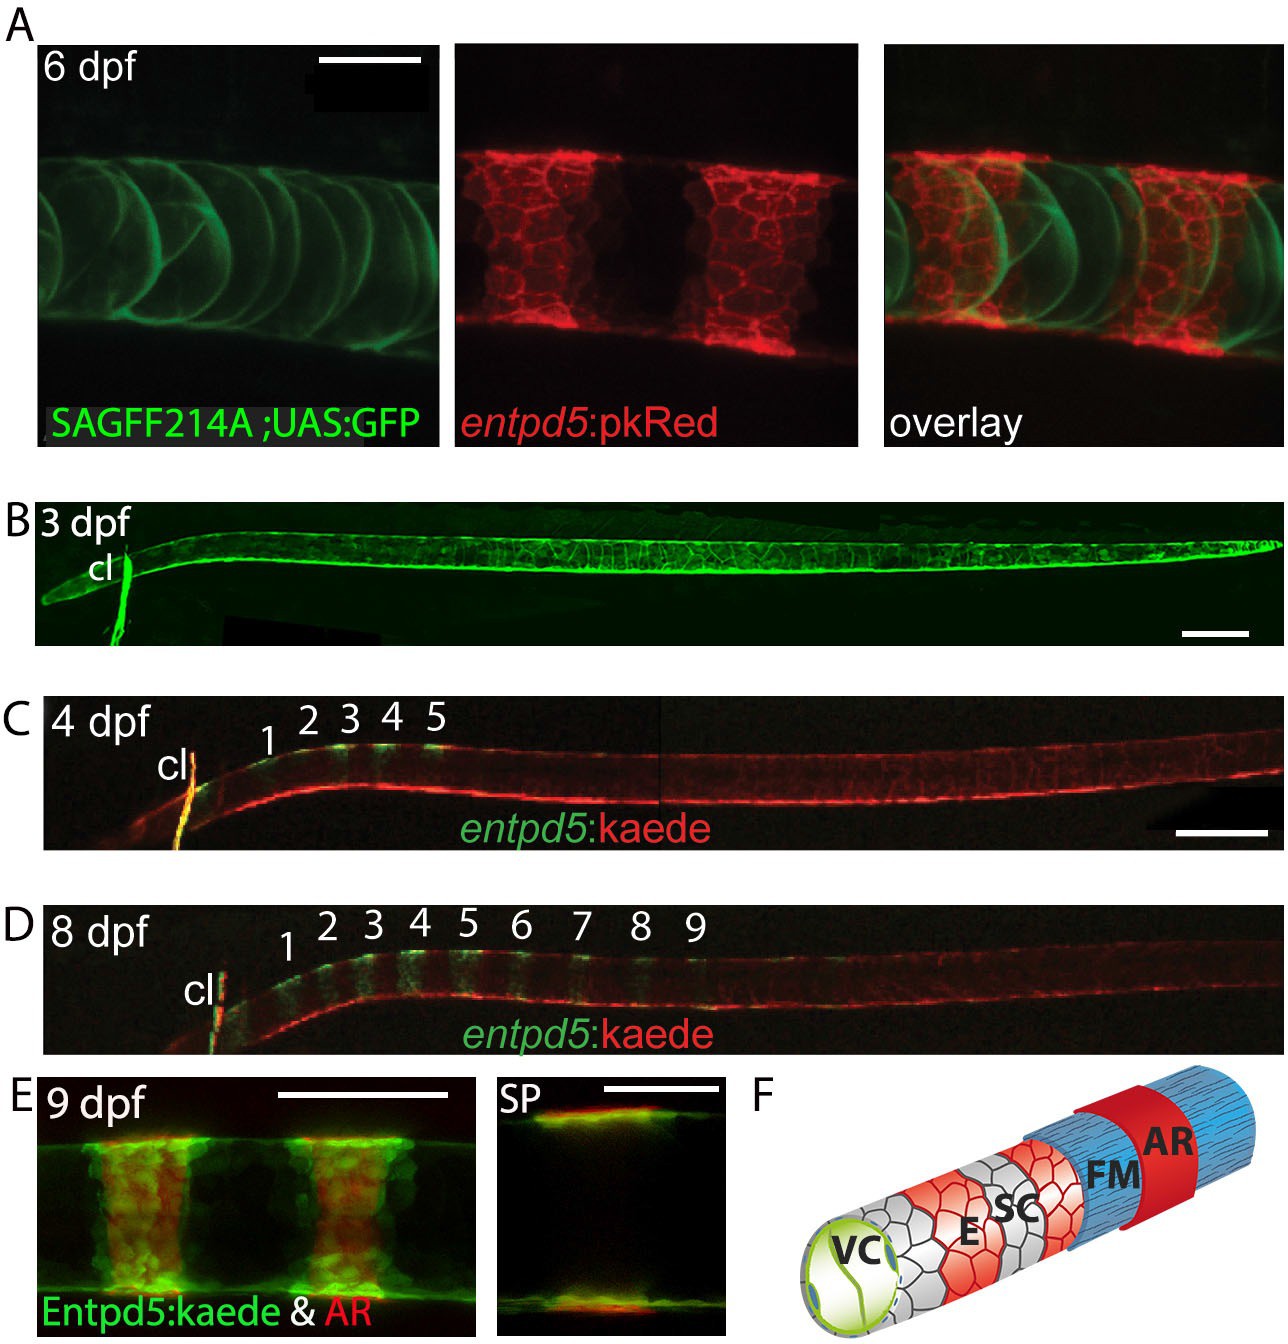
Fig. 3
Segmental entpd5 expression in notochord sheath cells marks the sites of chordacentrum mineralization.
(A-D) Confocal images of live transgenic entpd5 reporter larvae in lateral view with anterior to left. (A) At 6 dpf, entpd5 is expressed only in notochord sheath cells and not in vacuolated notochord cells, labelled by SAGFF214A;UAS:GFP. (B) At 3 dpf entpd5 is expressed in the whole notochord and does not display a segmented pattern. (C,D) Transgenic entpd5:Kaede embryos were photoconverted at 3 dpf and imaged at 4 dpf (C) and 8 dpf (D), respectively. New axial expression domains (green) are restricted to a segmental pattern within the axis and the cleithrum (cl). (E) Live confocal imaging of entpd5:Kaede expression in larvae also stained with Alizarin Red (AR) in lateral view (left) and sagittal view (SP). entpd5+ expression domains overlap with areas of mineralization (left), and notochord sheath cells (green) localize proximal to the site of mineralization of the future chordacentra. (F) Schematic illustration depicting the innermost vacuolated cells (VC) and the alternating pattern of entpd5+ (red, E) and entpd5- (grey) notochord sheath cells (SC). The sheath cells are surrounded by a fibrous matrix (FM), which in turn becomes mineralized in entpd5+ areas. cl, cleithrum. Scale bar for A and E is 40 �m, scale bar for B and C is 150 �m.