
|
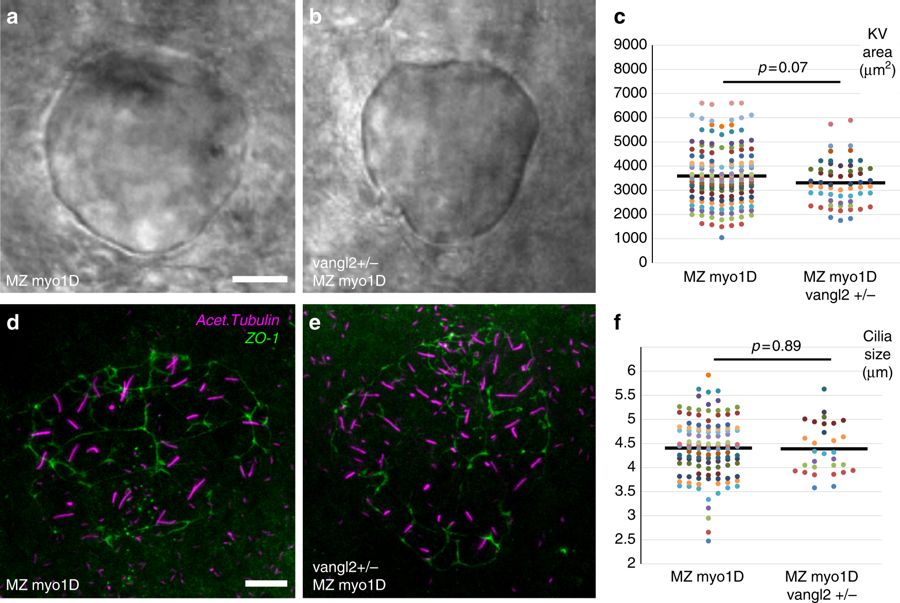
Fig. 5
KV area and cilia size are similar in MZ myo1D and MZ myo1D vangl2+/?. a?c MZ myo1D (n?=?156) and MZ myo1D ; vangl2+/? (n?=?60) animals have similar KV sizes. d?e Projection of images from confocal stacks used to quantify the length of cilia (acetylated tubulin, magenta) in the KV (ZO-1 positive cells, green) of MZ myo1D mutants (d), or MZ myo1D ; vangl2+/? embryos (e). f MZ myo1D (n?=?117 embryos/4939 cilia) and MZ myo1D ; vangl2+/? (n?=?30/1653) embryos present a similar cilia size. The MZ myo1D mutant dataset displayed in f is the same that is also displayed in Fig. 3j. a, b, d, e are dorsal views of eight-somites stage KVs, anterior up. Scale bars: 20?�m in a, b; 10?�m in d, e