Fig. S2
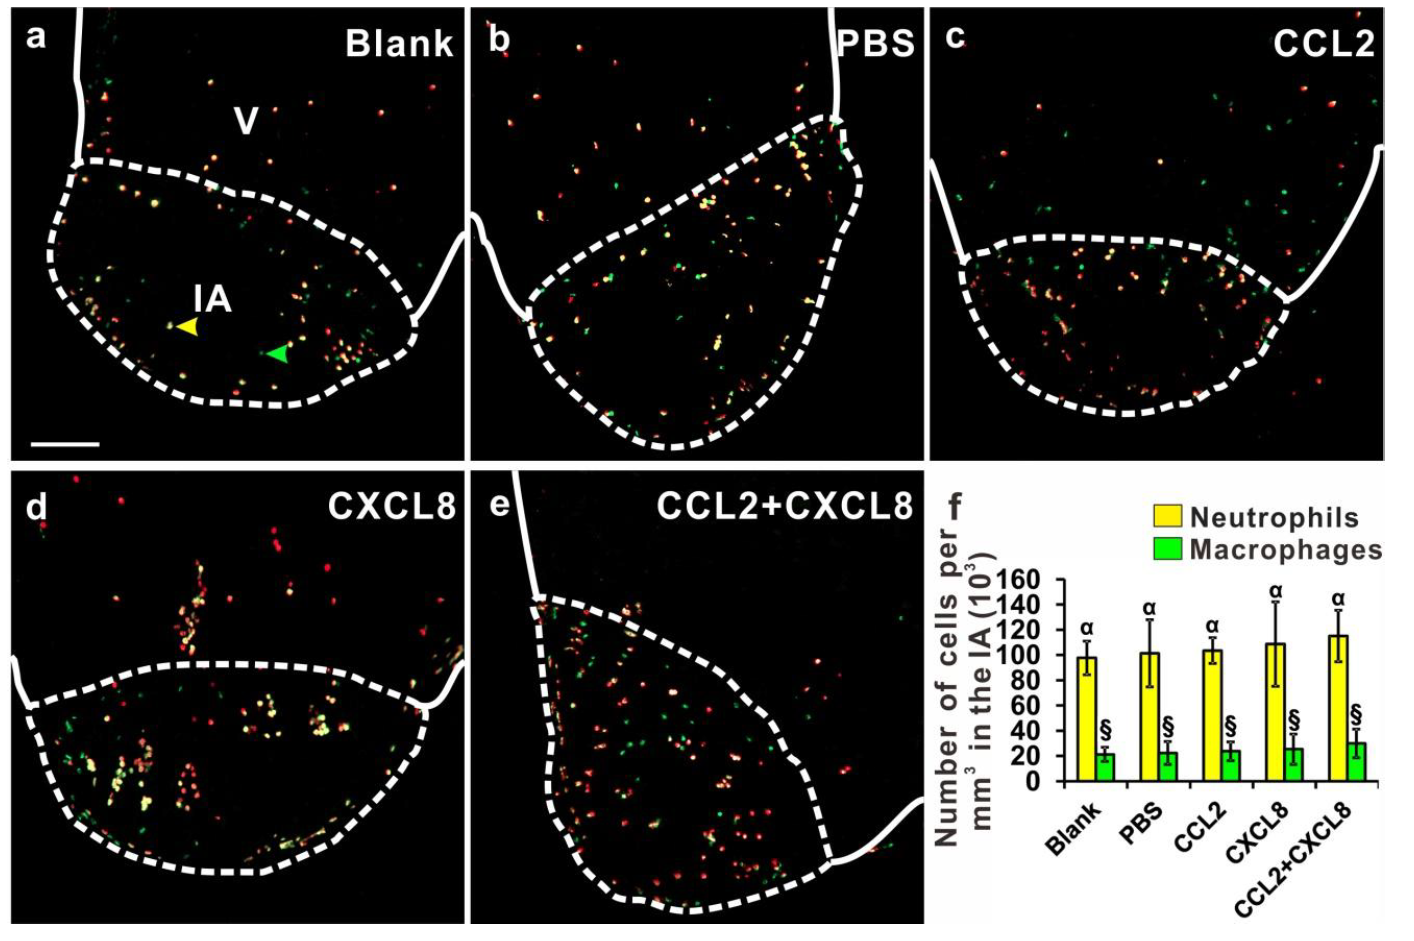
Injection of the chemokines did not affect the number of inflammatory cells in the injured area (IA). Using the Tg (coro1a:EGFP; lyz:dsRed) line of fish, the heart was cryoinjured and either: (a) not injected (as a blank control), or else injected with: (b) PBS; (c) CCL2; (d) CXCL8; or (e) CCL2 and CXCL8, after which the numbers of neutrophils (labeled in yellow) and macrophages (labeled in green) were quantified. Scale bar, 200 ?m. (f) Bar graph to show the numbers (mean ± standard deviation, n= 5 to 6 hearts) of neutrophils and macrophages per mm3 in the IA of fish at 1 dpc following the treatment regimens conducted in (a-e). The number of neutrophils in cryoinjured hearts following the treatments described in (a-e) were 95.7±13.3, 101.4 ±9.1, 103.6±10.1, 108.7±33.5 and 115.1±20.4 ×10³ cells per mm3, respectively; and the number of macrophages were 20.2±5.6, 22.3±9.4, 23.7±7.4, 25.4±12.0 and 29.9±11.3 ×10³ cells per mm3, respectively. Statistical analysis was carried out by One-way ANOVA and significant differences (at p<0.05) are shown by the different symbols above the bars.

