
|
Fig. S5
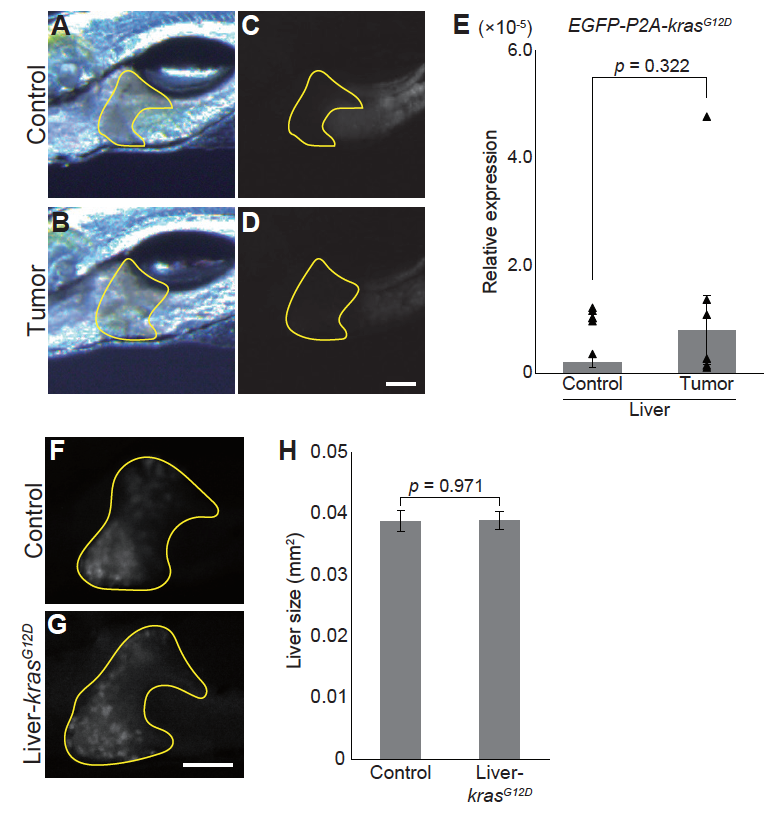
Hepatomegaly phenotype is not caused by leaky expression of krasG12D in the liver
(A)-(D) Representative images for the livers of sibling controls and tumor-bearing larvae. Bright field images (A-B) and EGFP images (C-D) are shown. The liver is encircled by yellow lines. Scale bar indicates 100 ?m. (E) qPCR analysis for EGFP-P2A-krasG12D in the liver. Because the transgene lacked intron, total RNAs were DNase-treated. In addition, samples without reverse transcription were included. The scores are normalized to expression of rpl13a. The data harbors 6 biological replicates, each containing 5 larvae. Bars and dots represent averages and each value, respectively. Error bars represent ? s.e.m. Statistical significance was tested using student's t-test (unpaired, two-tailed). Although not excluded, note that there is a potential outlier in data from tumor-bearing larvae. (F)-(G) Representative RFP images for the livers of the sibling controls (F) and larvae expressing krasG12D driven by Liver-Gal4 (G) at 7 dpf. The liver is encircled by yellow lines. Scale bar indicates 100 ?m. (H) Liver size of the sibling controls and krasG12D-expressing larvae at 7 dpf. The liver was identified by the RFP signal and liver size was measured using ImageJ software. The data harbors 12 biological replicates. Error bars represent ? s.e.m. Statistical significance was tested using student's t-test (unpaired, two-tailed). In (A)-(E), sibling controls (Control) represent Tg(pInt-Gal4)+/Tg; Tg(UAS:EGFP)+/Tg and tumor-bearing larvae (Tumor) represent Tg(pInt-Gal4)+/Tg; Tg(5?UAS:EGFP-P2Akras G12D)+/Tg. In (F)-(G), sibling controls (Control) represent Tg(Liver-Gal4)+/Tg; Tg(UAS:RFP)+/Tg and Liver-krasG12D represents Tg(Liver-Gal4)+/Tg; Tg(UAS:RFP)+/Tg; Tg(5?UAS:EGFP-P2A-krasG12D)+/Tg.