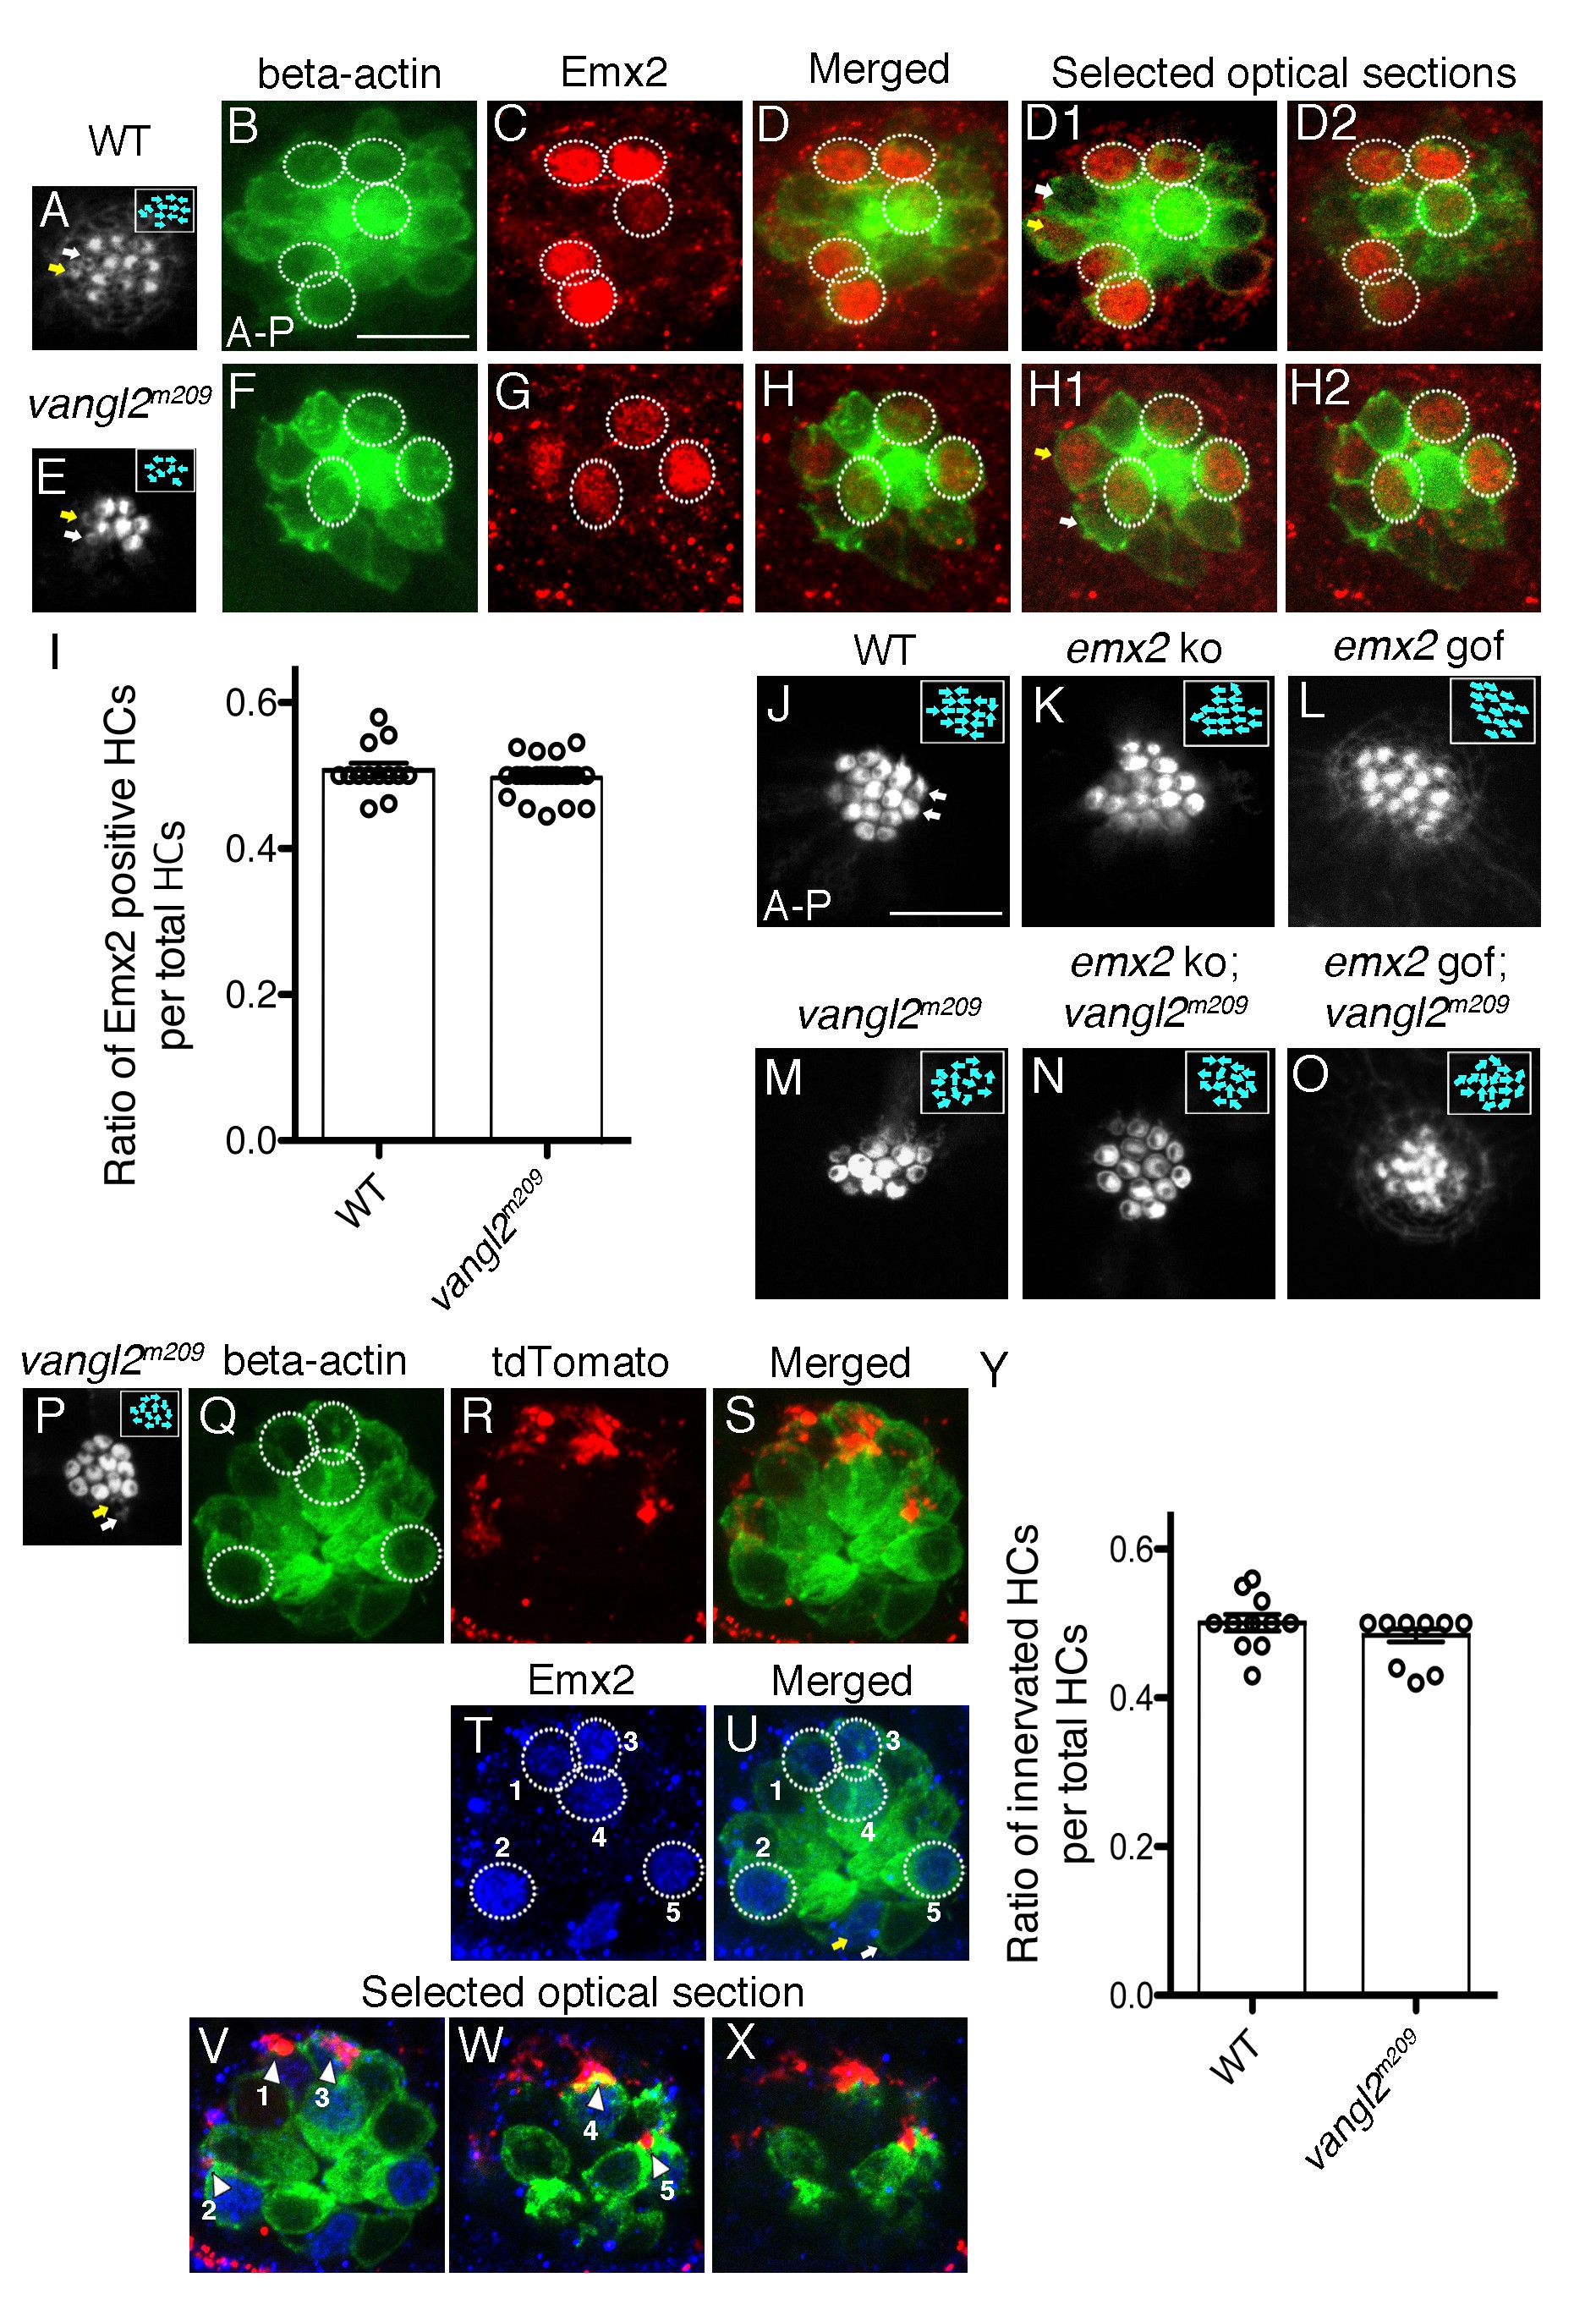
Fig. 8
Selectivity of single-afferent neurons in vangl2m209 mutants correlates with Emx2 expression.
(A–D2) A wildtype myo6b:actb1-GFP neuromast consists of five A > P, five P > A and two immature HCs (yellow and white arrows, (A,D1)), in which Emx2 expression is restricted to the five A > P (circles) and one of the immature HCs (yellow arrow, (D1)). (D) A merged image of (B) and (C), and (D1,D2) are selected optical sections of (D). (E–H2) A vangl2m209; myo6b:actb1-GFP neuromast consists of six mature and two immature HCs (yellow and white arrows) that are randomly polarized (E,F), and Emx2 is expressed in three mature (circles) and one of the immature HCs (yellow arrow, (H1)). (H) A merged image of (E) and (F), and (H1,H2) are selected optical sections of (H). (I) The percentage of Emx2-positive HCs within a neuromast is similar between wildtype and vangl2m209 mutant neuromasts. N.S. Student’s t-test. The number of neuromasts: WT, n = 10; vangl2m209, n = 22, combined results from three independent experiments. (J–O) Phalloidin-staining of neuromasts from various genotypes. (J) A wildtype neuromast containing seven A > P, seven P > A and two immature HCs (white arrows). Hair bundle orientation is random in vangl2m209 (M), emx2 ko; vangl2m209 (N), and emx2 gof; vangl2m209 (O) neuromasts. (P–X) Phalloidin (P) and GFP (Q) staining of a vangl2m209; myo6b:actb1-GFP neuromast showing random hair bundle orientation (n = 3). (R) Neuronal processes of a single neuroD:tdTomato-labeled afferent neuron contacts all five Emx2-positive HCs ((T), circles) in the neuromast (Q–X) and none of the Emx2-negative HCs. (V–X) Selected optical sections of (Q,R,T) showing the relationship between Emx2-positive HCs (blue nuclei in green HCs) and tdTomato-positive afferent processes (arrowheads). (Y) A graph showing the ratio of innervated HCs to total HCs in wildtype and vangl2m209 neuromasts. The number of neuromasts: WT, n = 11; vangl2m209, n = 13. N.S., student’s t-test.

