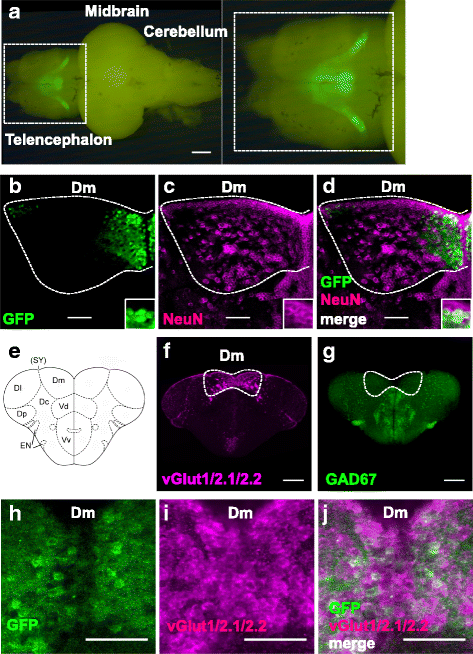
Fig. 8
Immunohistochemical analyses of the 120A-Dm neurons. a Fluorescence imaging of the brain of SAGFF120A;UAS:GFP fish from the dorsal side. Dm, medial zone of the dorsal telencephalic area. Scale bars, 500 ?m. b?d Double immunofluorescence staining of the telencephalon of SAGFF120A;UAS:GFP fish using the anti-GFP (green) (b) and anti-NeuN (magenta; neuronal marker) (c) antibodies. d A merged image; 16% (1986/12282) of NeuN-positive cells were GFP-positive and 99% (2394/2423) of GFP-positive cells were NeuN-positive. e A coronal view of the zebrafish telencephalon. Dm, medial zone of dorsal telencephalic area (D); Dl, lateral zone of D; Dc, central zone of D; Dp, posterior zone of D; SY, sulcus ypsiloniformis; Vd, dorsal nucleus of ventral telencephalic area (V); Vv, ventral nucleus of V; EN, entopeduncular nucleus. f Fluorescence in situ hybridization using the vglut1/2.1/2.2 probes. g Fluorescence in situ hybridization using the GAD67 probe. h?j Immunofluorescence staining of the telencephalon of SAGFF120A;UAS:GFP fish using anti-GFP (green) (h) and fluorescence in situ hybridization using vglut1/2.1/2.2 probes (magenta) (i). j A merged image; 94% (352/374) of GFP-positive cells were glutamatergic. Scale bars, 200 ?m (f, g) and 50 ?m (b?d, h?j)

