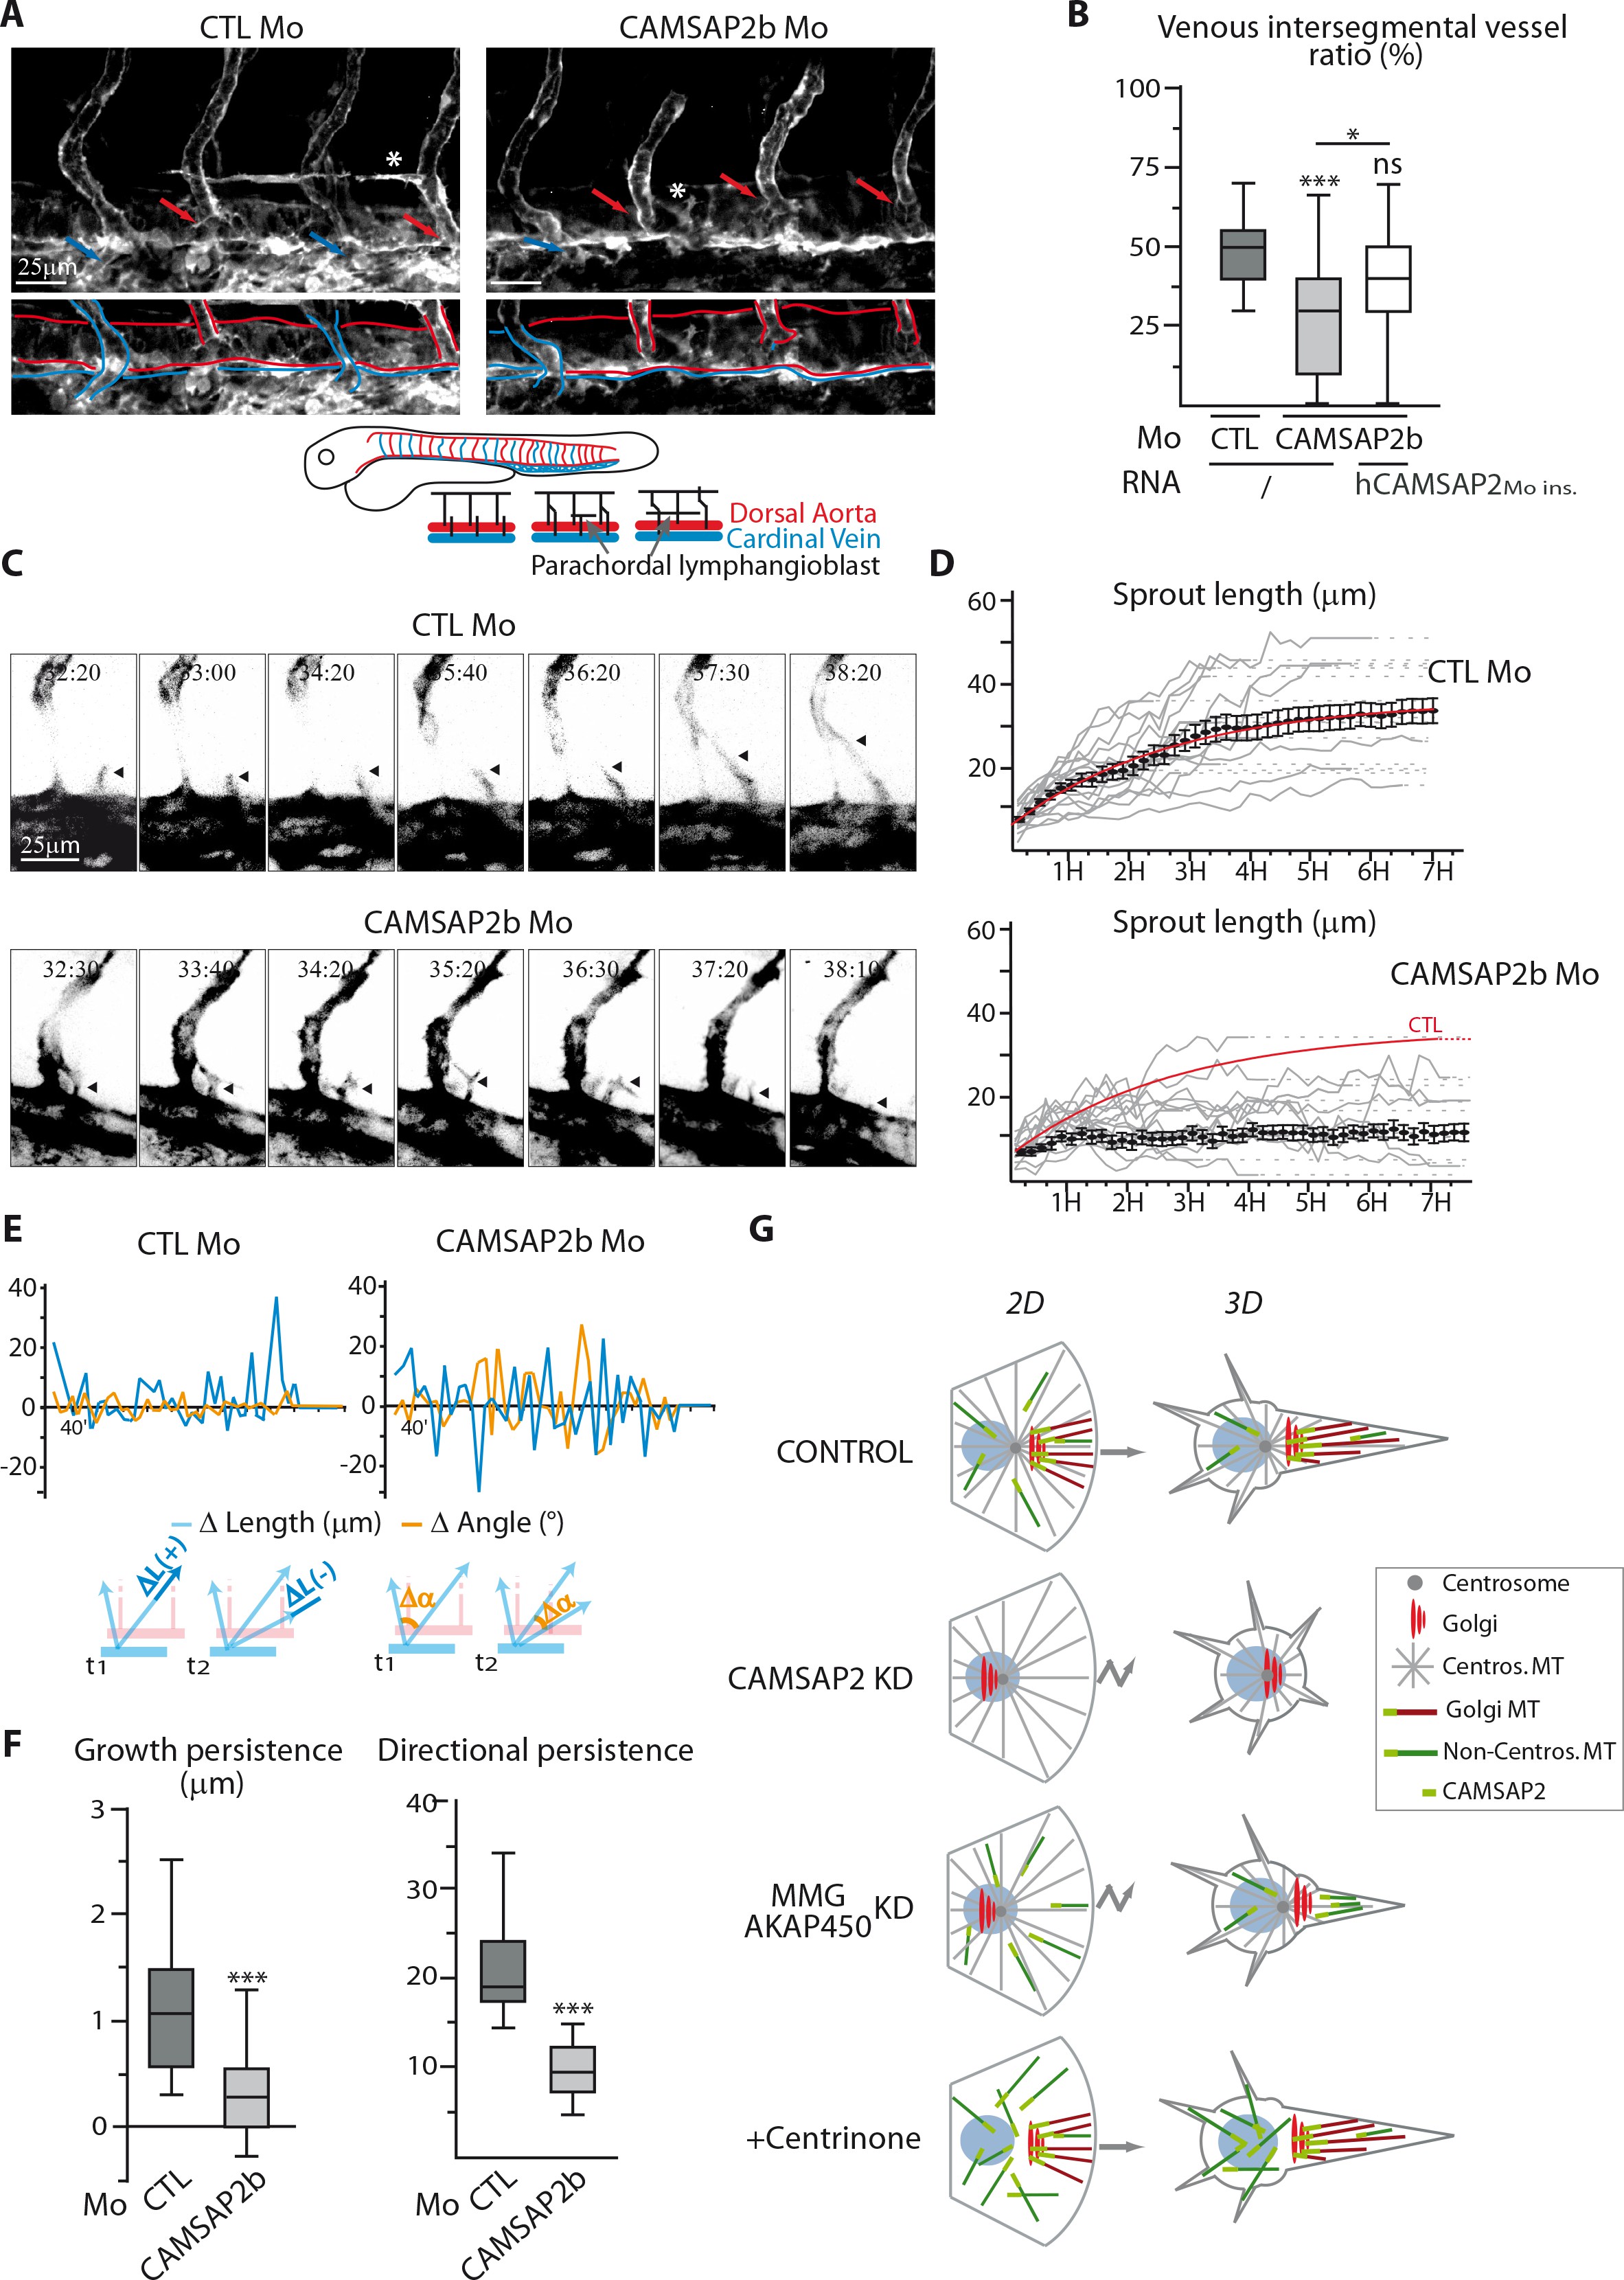
Fig. 9
CAMSAP2 plays a role in sprouting angiogenesis in vivo.
(A) Live confocal images (Z-maximum projections) of 48 hpf Tg(Fli1ep:Lifeact-EGFP) embryos injected with control or CAMSAP2b morpholinos. Arterial and venous intersegmental vessels are indicated by red and blue arrows and highlighted with red and blue lines on the bottom pictures, respectively. Asterisks show parachordal lymphangioblast in control embryo and an abnormal venous sprout in CAMSAP2b morphant embryo. (B) Quantification of the percentage of venous intersegmental vessels in the same 10 somite-region in the trunk of embryos injected with control or CAMSAP2b morpholinos, or co-injected with CAMSAP2b morpholinos and RNA coding for a morpholino-insensitive mutant of human CAMSAP2, n = 90, 80 and 45 embryos in six, six and three independent experiments. (C) Frames (Z-maximum projections) from time-lapse confocal imaging of venous sprouting in control and CAMSAP2b-depleted embryos. Time is hr:min post-fertilization. Arrowheads point to the growing venous sprout. See also Videos 1?5. (D) Graphs representing venous sprout length over time measured during their growing period from the time-lapse imaging described in (C) in control and CAMSAP2b morphant embryos. Grey curves represent individual growing events, black dots indicate the average length at each time point ąSEM and the result of curve fitting (exponential - one phase association) in control embryos is drawn in red. (E) Graphs representing length (blue lines, ?L in the scheme) and angle (orange lines, ?? in the scheme) variations of growing venous sprouts between each successive time point (t1 and t2 in the scheme) from the time-lapse imaging described in (C). One representative plot (out of 19 and 18) is shown for each condition. (F) Quantification of the average growth and directional persistence per growing event calculated from data described in (E) and as explained in the Materials and methods: the growth persistence was obtained by averaging the length variations (? Length) between two consecutive time frames per growing event whereas directional persistence was calculated as the inverse of the sinus of the angle variation (its absolute value) for each frame and then averaged per growth event, n = 19 and 18 sprouts in three independent experiments. (G) Model of the impact of MT array organization on endothelial polarization and movement in 2D and 3D. Control ECs contain three distinct populations of MT, the centrosomal MTs (grey), the non-centrosomal, Golgi-anchored MTs (burgundy) and the non-centrosomal non-Golgi-anchored MTs (dark green). The two non-centrosomal MT populations are stabilized by the presence of CAMSAP2 stretches at their minus-ends (light green rectangle). During 2D migration, the presence of Golgi-originating MTs, which are lost after CAMSAP2, MMG or AKAP450 depletion, ensures proper Golgi polarization and directional migration. In the context of 3D sprouting, both non-centrosomal populations are enriched in a single protrusion, which becomes larger and more stable than the rest. Centrosomal MTs are dispensable for both processes. Data are shown using box plots except in (D): mean ąSEM; Chi square test with Yates correction (B), Mann-Whitney U test (F): ***p<0.001, *p<0.05, ns, no significant difference.

