Fig. 6
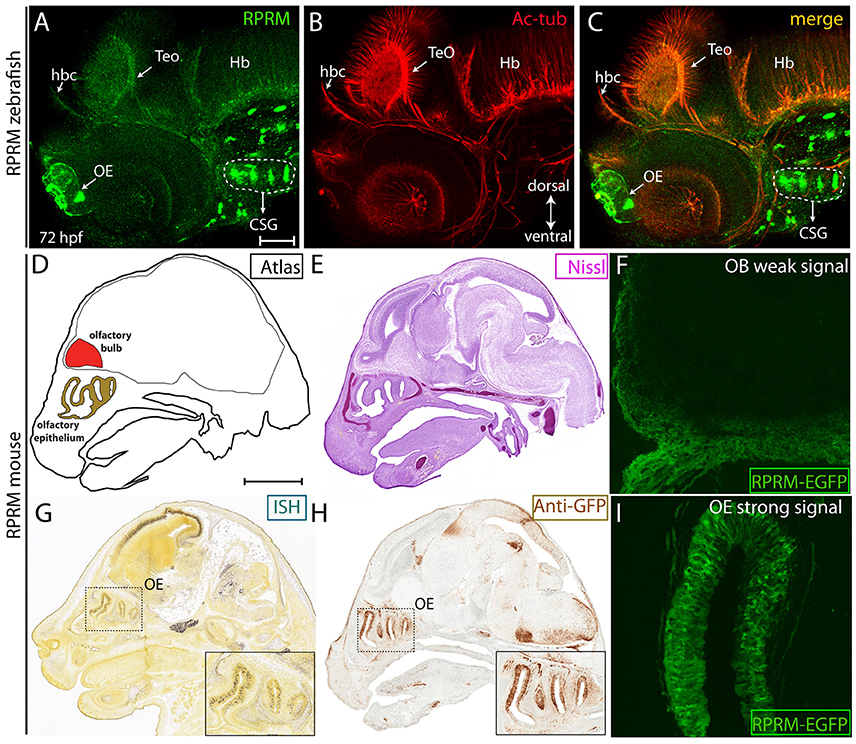
RPRM expression is conserved between zebrafish and mice. (A?I) Zebrafish RPRM protein expression, visualized by IF at 72 hpf, presents similar expression patterns when compared with murine RPRM in comparable developmental stages. (A?C) Lateral view of a representative 72 hpf embryo by IF, showing RPRM (green) and Ac-tub (red) expression in the habenular commissure (hbc), OE, TeO, CSG, and hindbrain (Hb). Dorsal is show to the top and ventral to the bottom (double arrow in B) (D) Sagittal atlas image of E15.5 mouse embryo showing reference areas of the OS (OE, OB). (E) Nissl staining of sagittal section from E15.5 mouse embryo. (G,H) RPRM expression as detected by in situ hybridization (ISH) and (F) immunohistochemistry (IHC) for anti-GFP in the transgenic mice line TG(BAC-180MB-RPRM-EGFP). (F?I) RPRM expression pattern in TG(BAC-180MB-RPRM-EGFP) sections, showing low levels of RPRM gene products in the OB/OS (F) and high levels of expression in the OE (I). Scale Bars in (A): 100 ?m, in (D): 1 mm.

