
|
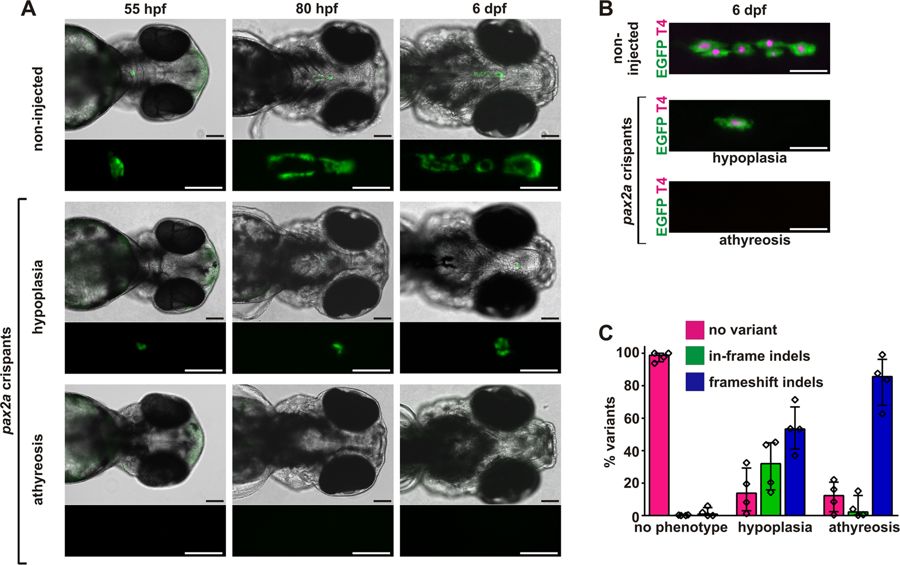
Fig. 3
Recovery of thyroid dysgenesis phenotypes in zebrafish pax2a crispants. (A) Epifluorescence live imaging of Tg(tg:nlsEGFP) zebrafish. Ventral views of the head region (anterior to the right, scale bar: 100?�m) and magnified views of the thyroid region (GFP channel only, scale bar: 50?�m) are shown for non-injected controls and pax2a crispants at 55 hpf, 80 hpf, and 6 dpf. Phenotypic pax2a crispants displayed athyreosis or severe hypoplasia. (B) Whole-mount immunofluorescence staining of Tg(tg:nlsEGFP) zebrafish (6 dpf) for EGFP (thyroid cells) and thyroxine (colloidal T4). Epifluorescence imaging of the thyroid region in 6 dpf larvae (ventral views, anterior to the right, scale bar: 100?�m) revealed variable but reduced T4 content in pax2a crispants with thyroid hypoplasia and confirmed the absence of detectable T4 synthesis in pax2a crispants lacking EGFP-tagged thyroid cells (athyreosis group). (C) Distribution of allelic variants as determined by Illumina HiSeq analysis of individual pax2a crispants confirmed high mutagenesis efficiency in larvae affected by thyroid dysgenesis. The percentage of WT alleles (no variant call), in-frame indels, or frameshift indels is shown for N?=?4 larvae per phenotypic category (median values with interquartile range).