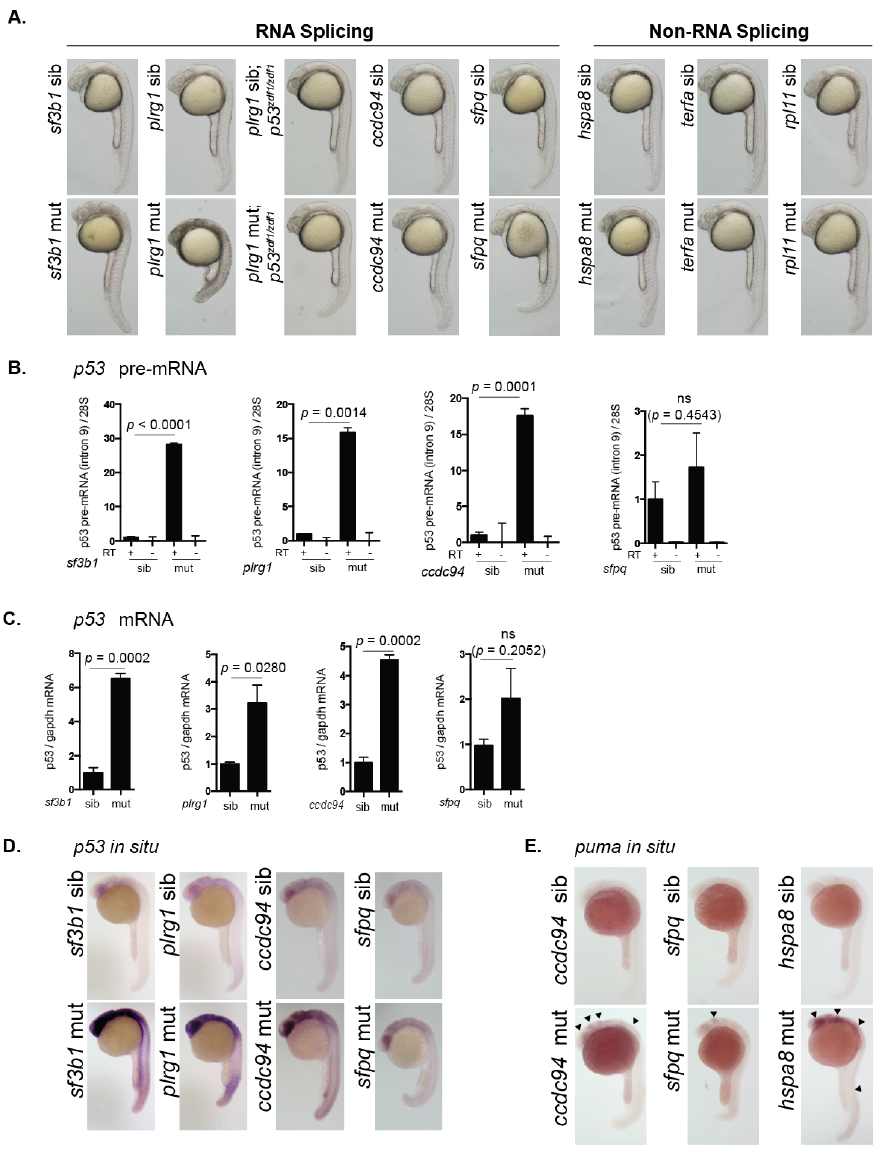
Fig. S2
Splicing-factor mutants have elevated levels of tp53.
(A) Sibling and mutant embryos from sf3b1hi3394aTg, plrg1hi3174aTg, plrg1hi3174aTg;p53zdf1/zdf1, ccdc94zd1000, sfpqhi1779Tg, hspa8hi138Tg, terfahi3678Tg, and rpl11hi3820bTg were imaged by bright-field microscopy at 25 hpf. Mutant phenotypes include neurodegeneration, curved tail, heart edema, and yolk extension defects. terfahi3678Tg and rpl11hi3820bTg mutants are indistinguishable from siblings at this time point. (B) Splicing factor mutants and siblings were separated by phenotype. RNA was harvested from each group at 30 hpf, DNAse treated, and reverse transcribed using random hexamer primers. Intron 9 of tp53 was analyzed by qPCR to determine levels of tp53 pre-mRNA. Minus reverse transcriptase (-RT) samples were included to control for genomic DNA contamination. tp53 pre-mRNA levels were normalized to 28S RNA levels to yield a relative amount of RNA expression between groups. (C) RNA collected from embryos described in (B) was reverse transcribed using oligo-dT primers and analyzed by qPCR for tp53 mRNA expression. gapdh mRNA levels were analyzed to determine relative amount of RNA expression per group. ns; not significantly different. (D) Splicing factor mutants and siblings were grown to 24 hpf and analyzed by whole mount in situ hybridization for tp53 mRNA expression. (E) Sibling and mutant embryos from ccdc94zd1000, sfpqhi1779Tg, and hspa8hi138Tg were grown to 24 hpf and analyzed by whole mount in situ hybridization for the mRNA expression of the Tp53-target gene puma.

