Image
Figure Caption
Fig. 1
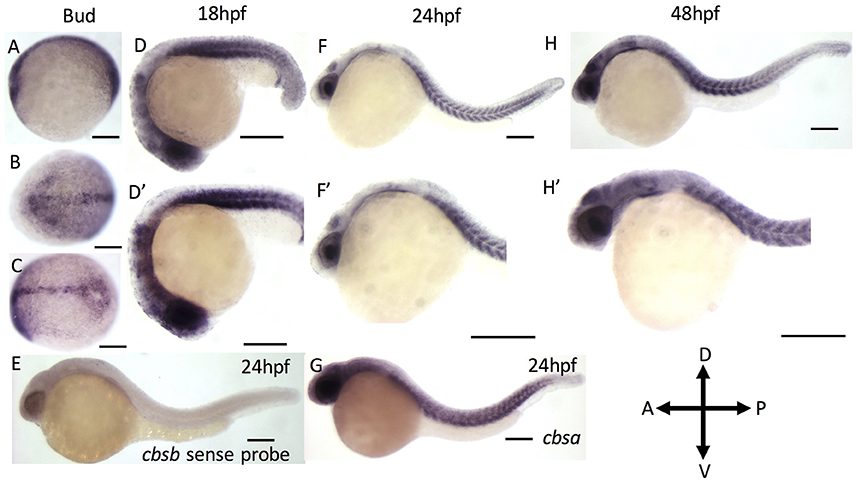
ISH analysis of cbsa and cbsb genes in zebrafish embryos. (A?G) are digioxigenin-labeled whole mount in situ hybridization for cbsa and cbsb RNA. Panels (A?C) are bud stage, (D,F,H) are 18, 24, and 48 hpf embryos respectively, Panels (D?H?) are high power images of the respective (D,F,H). Panel (E) is a cbsb sense probed 24 hpf embryo, and Panel (G) is a cbsa antisense probed embryo at 24 hpf. Scale bars indicate 0.25 mm.
Figure Data
Acknowledgments
This image is the copyrighted work of the attributed author or publisher, and
ZFIN has permission only to display this image to its users.
Additional permissions should be obtained from the applicable author or publisher of the image.
Full text @ Front Cell Dev Biol

