Fig. 7
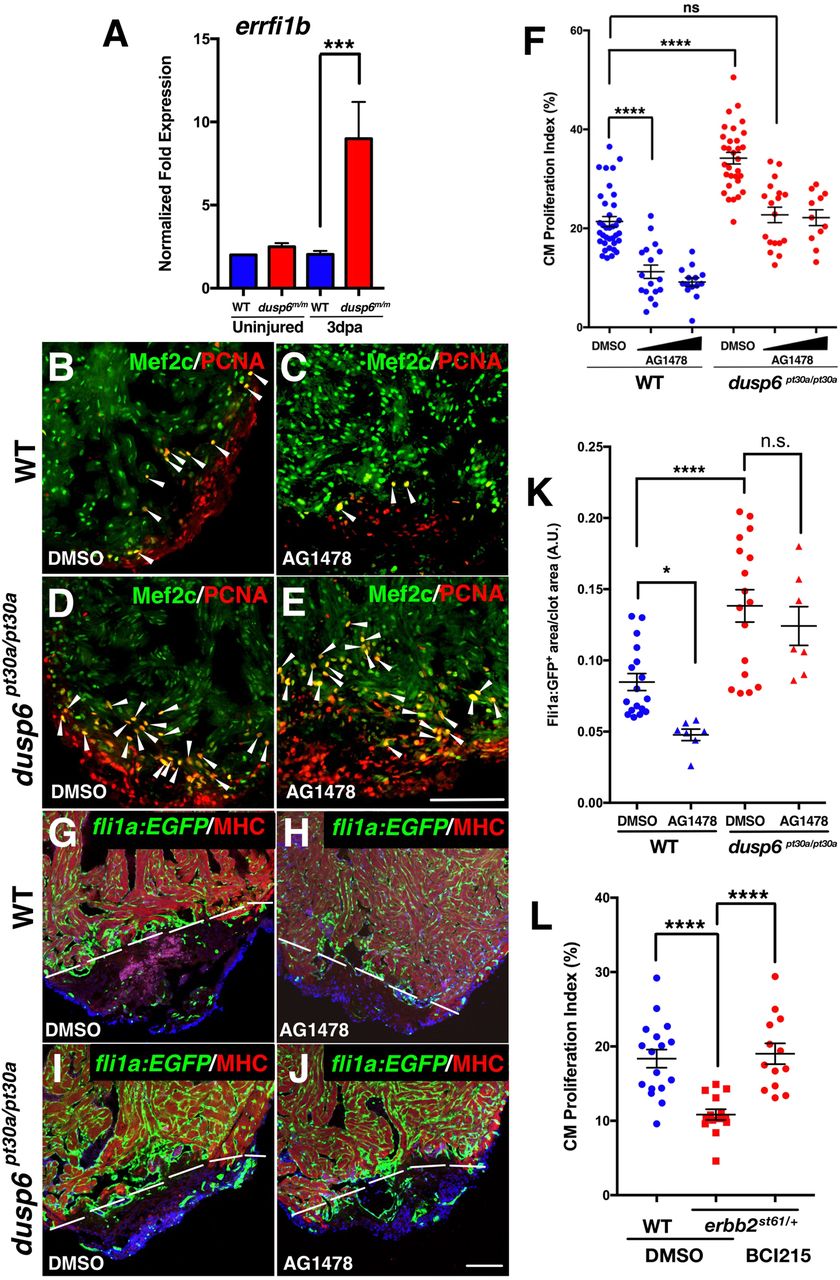
EGF receptor inhibition in dusp6 mutants dampens cardiac regeneration. (A) Q-PCR analysis of errfi1b at 0 and 3?dpa. After amputation, dusp6 mutant hearts show higher errfi1b expression compared with WT. Data represent six independent replicates. (B-E) Hearts at 7?dpa injected for 6?days with AG1478 (C,E), or DMSO vehicle (B,D) and stained for Mef2c and Pcna to determine cardiomyocyte proliferation. Arrowheads indicate proliferating cardiomyocytes. For WT: DMSO, n=36; 10?然 and 25?然 AG1478, n=17 and n=14, respectively. For dusp6pt30a/pt30a: DMSO, n=31; 10?然 and 25?然 AG1478, n=19 and n=13, respectively. (F) Quantification of cardiomyocyte proliferation in WT and dusp6 mutant hearts after injection of AG1478 or DMSO. (G-J) Tg(fli1a:EGFP)y1 hearts at 8?dpa injected with AG1478 (H,J) or DMSO (G,I). MHC (red) marks the resection plane. AG1478 treatment blocked angiogenesis in WT hearts, but not in dusp6 mutant hearts. Dashed line demarcates resection plane. n=17 for DMSO in WT and dusp6pt30a/pt30a; n=7 for 25?然 AG1478 in WT and dusp6pt30a/pt30a. (K) Quantification of new vessels formed at 8?dpa. (L) Quantification of cardiomyocyte proliferation in erbb2st61/+ hearts at 7?dpa, injected with BCI215 (n=13) or DMSO (n=14) as compared with sibling WT hearts (DMSO, n=17). erbb2st61/+ hearts have a diminished cardiomyocyte proliferation index compared with WT hearts, and this is rescued by BCI215. (A,F,K,L) ****P<0.0001, ***P<0.001, *P<0.05; ns, not significant; one-way ANOVA. Scale bars: 100?痠.

