Fig. 1
Genetic Loss of Function of Reelin Pathway Components Disrupts Synaptic Lamina Targeting of Retinal Ganglion Cell Axons in the Tectal Neuropil
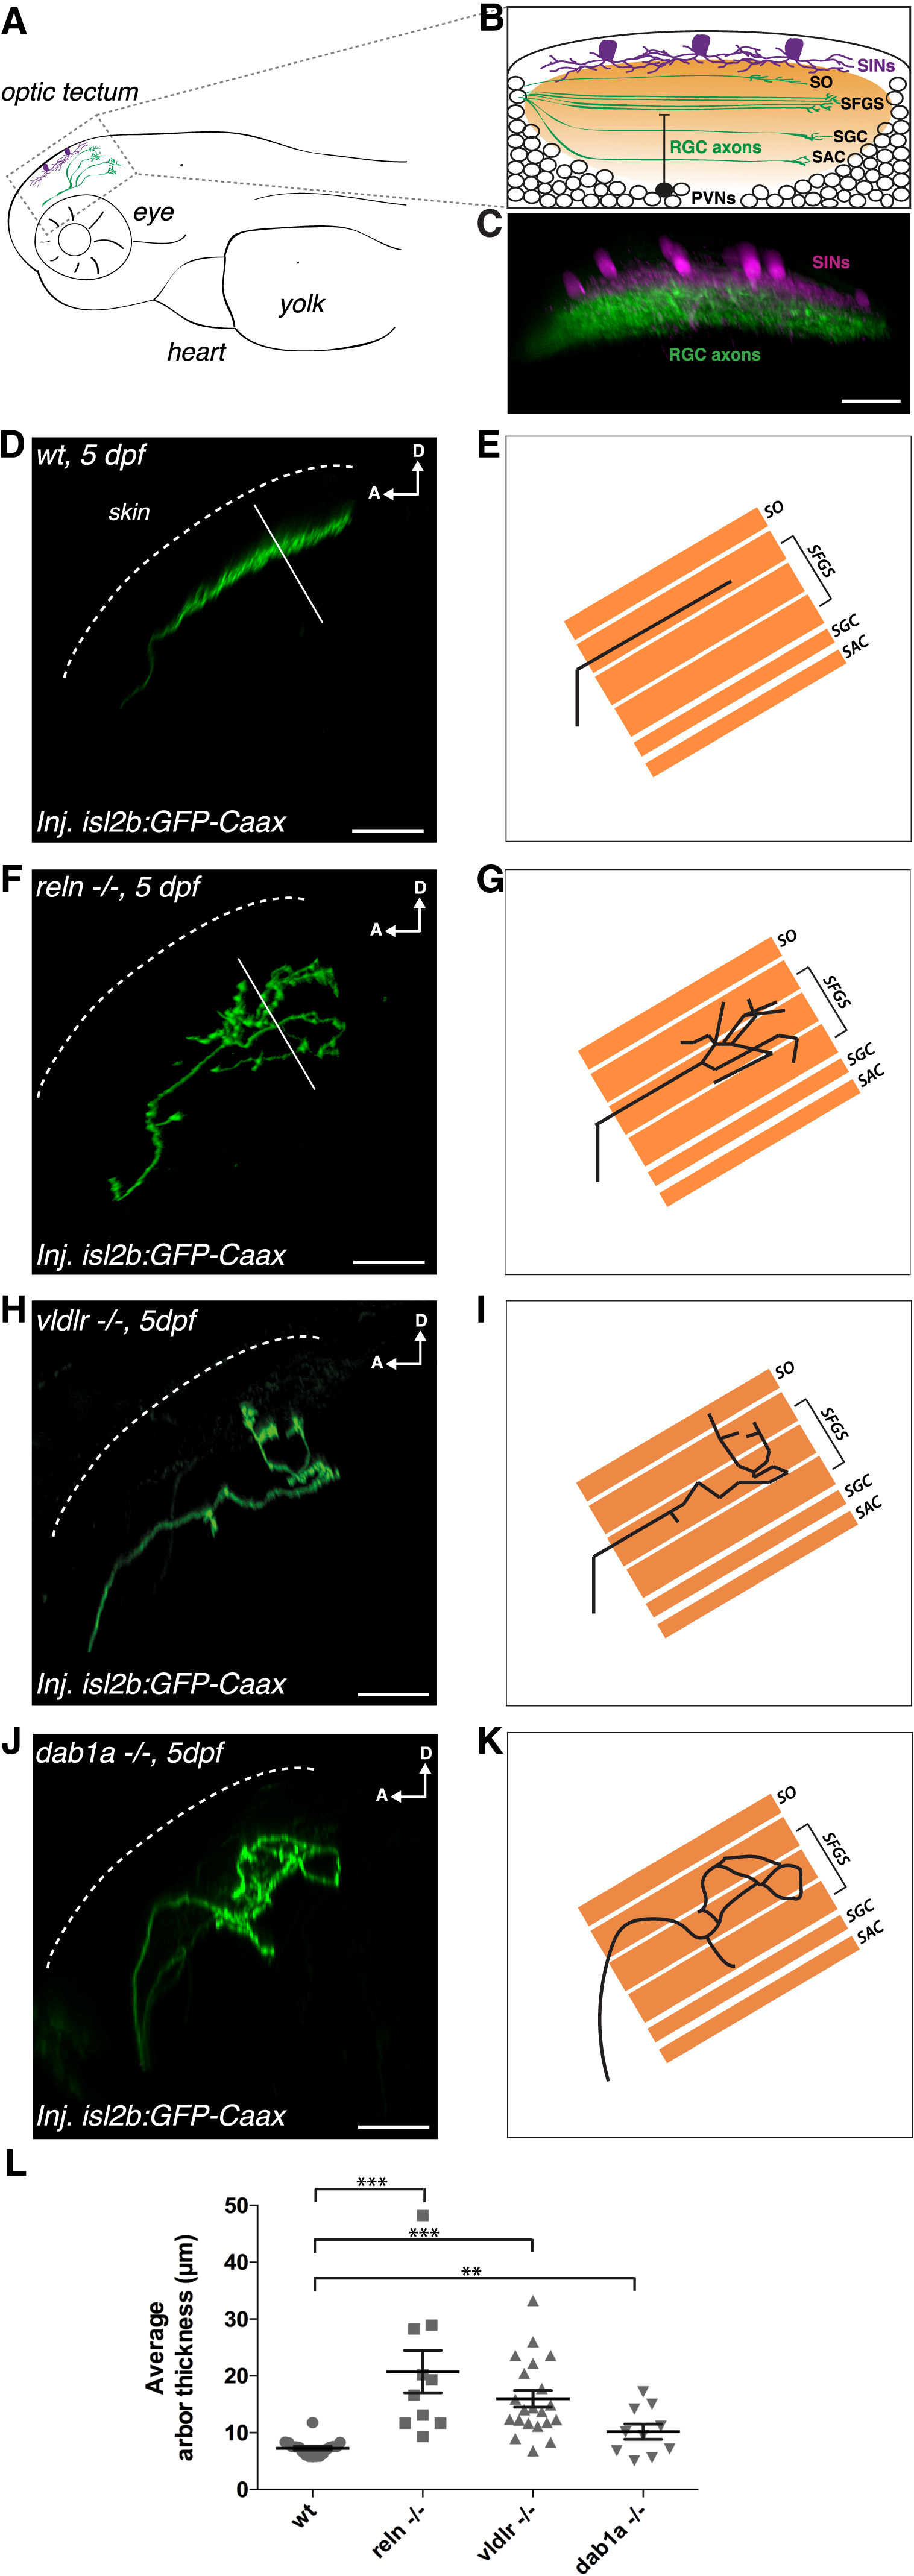
(A) Schematic lateral view of a 5 days post-fertilization (dpf) larva showing the anatomical localization of the optic tectum (inset).
(B) Schematic lateral view of the optic tectum showing the relative positions of the major tectal cell populations. SINs, superficial inhibitory neurons (in purple); RGC axons, retinal ganglion cell axons (in green); PVNs, periventricular neurons (white ellipses, example monostratified PVN shown as black cell). The tectal neuropil, consisting predominantly of axons and dendrites, is shown in orange and can be further subdivided into four main layers: stratum opticum (SO), stratum fibrosum et griseum superficiale (SFGS), stratum griseum centrale (SGC), and stratum album centrale (SAC).
(C) Lateral view of a confocal z-projection showing a 5 dpf Tg(s1156tEt; UAS:RFP) × Tg(Brn3C:mGFP) embryo displaying SINs in magenta (labeled by RFP) and RGC axons in green (labeled by mGFP). Scale bar, 20 ?m.
(D and E) Confocal reconstruction (D) and corresponding schematics (E) of one transiently isl2b:GFPCaax-labeled RGC axonal arbor in the tectum of a representative wild-type larva at 5 dpf shown from the side, parallel to the skin (dotted line), to highlight the RGCs? laminar morphologies. The labeled RGC axon targets only a single neuropil lamina. Arbor thickness was measured using the fluorescence profile along a line perpendicular to the skin across the RGC arbor (solid white line, see STAR Methods).
(F and G) Confocal reconstruction (F) and corresponding schematics (G) of a transiently GFP-labeled RGC axonal arbor in the tectum of a representative 5 dpf reln?/? larva highlighting the disruption of single lamina targeting. Arbor thickness was measured using the fluorescence profile along a line perpendicular to the skin across the RGC arbor (solid white line, see STAR Methods).
(H and I) Confocal reconstruction (H) and corresponding schematics (I) of a transiently GFP-labeled RGC axonal arbor in the tectum of a representative 5 dpf vldlr?/? larva showing aberrant laminar targeting.
(J and K) Confocal reconstruction (J) and corresponding schematics (K) of a transiently GFP-labeled RGC axonal arbor in the tectum of a representative 5 dpf dab1a?/? mutant larva spanning multiple laminae in the neuropil.
(A?K) SO, stratum opticum; SFGS, stratum fibrosum et griseum superficiale; SGC, stratum griseum centrale; SAC, stratum album centrale; D, dorsal; A, anterior. Scale bars, 20 ?m.
(L) Average RGC arbor thickness in wild-type (n = 18 larvae, 37 RGCs total, mean arbor thickness per larva = 7.3 ?m ± 0.3 ?m SEM), reln?/? (n = 10 larvae, 22 RGCs in total, mean arbor thickness per larva = 20.7 ?m ± 3.7 ?m SEM), vldlr?/? (n = 21 larvae, 48 RGCs in total, average arbor thickness per larva = 16.0 ?m ± 1.5 ?m SEM), and dab1a?/? larva (n = 10 larvae, 28 RGCs in total, average RGC arbor thickness per larva = 10.2 ?m ± 1.3 ?m SEM). The average arbor thickness per larva was significantly larger in reln?/?, vldlr?/?, and dab1a?/? larvae compared to wild-type larvae, respectively (one-tailed two-sample t tests, wild-type < reln?/? p = 2.5e?05, wild-type < vldlr?/? p = 1.9e?06, wild-type < dab1a?/? p = 0.006). This suggests that genetic loss of function of components of the Reelin pathway disrupts the ability of retinal ganglion cell arbors to find their corresponding synaptic lamina in the tectum. Error bars represent mean ± SEM across larvae. ??p < 0.01, ???p < 0.001, one-tailed two-sample t test.
See also Figures S1 and S2.

