Fig. 4-S1
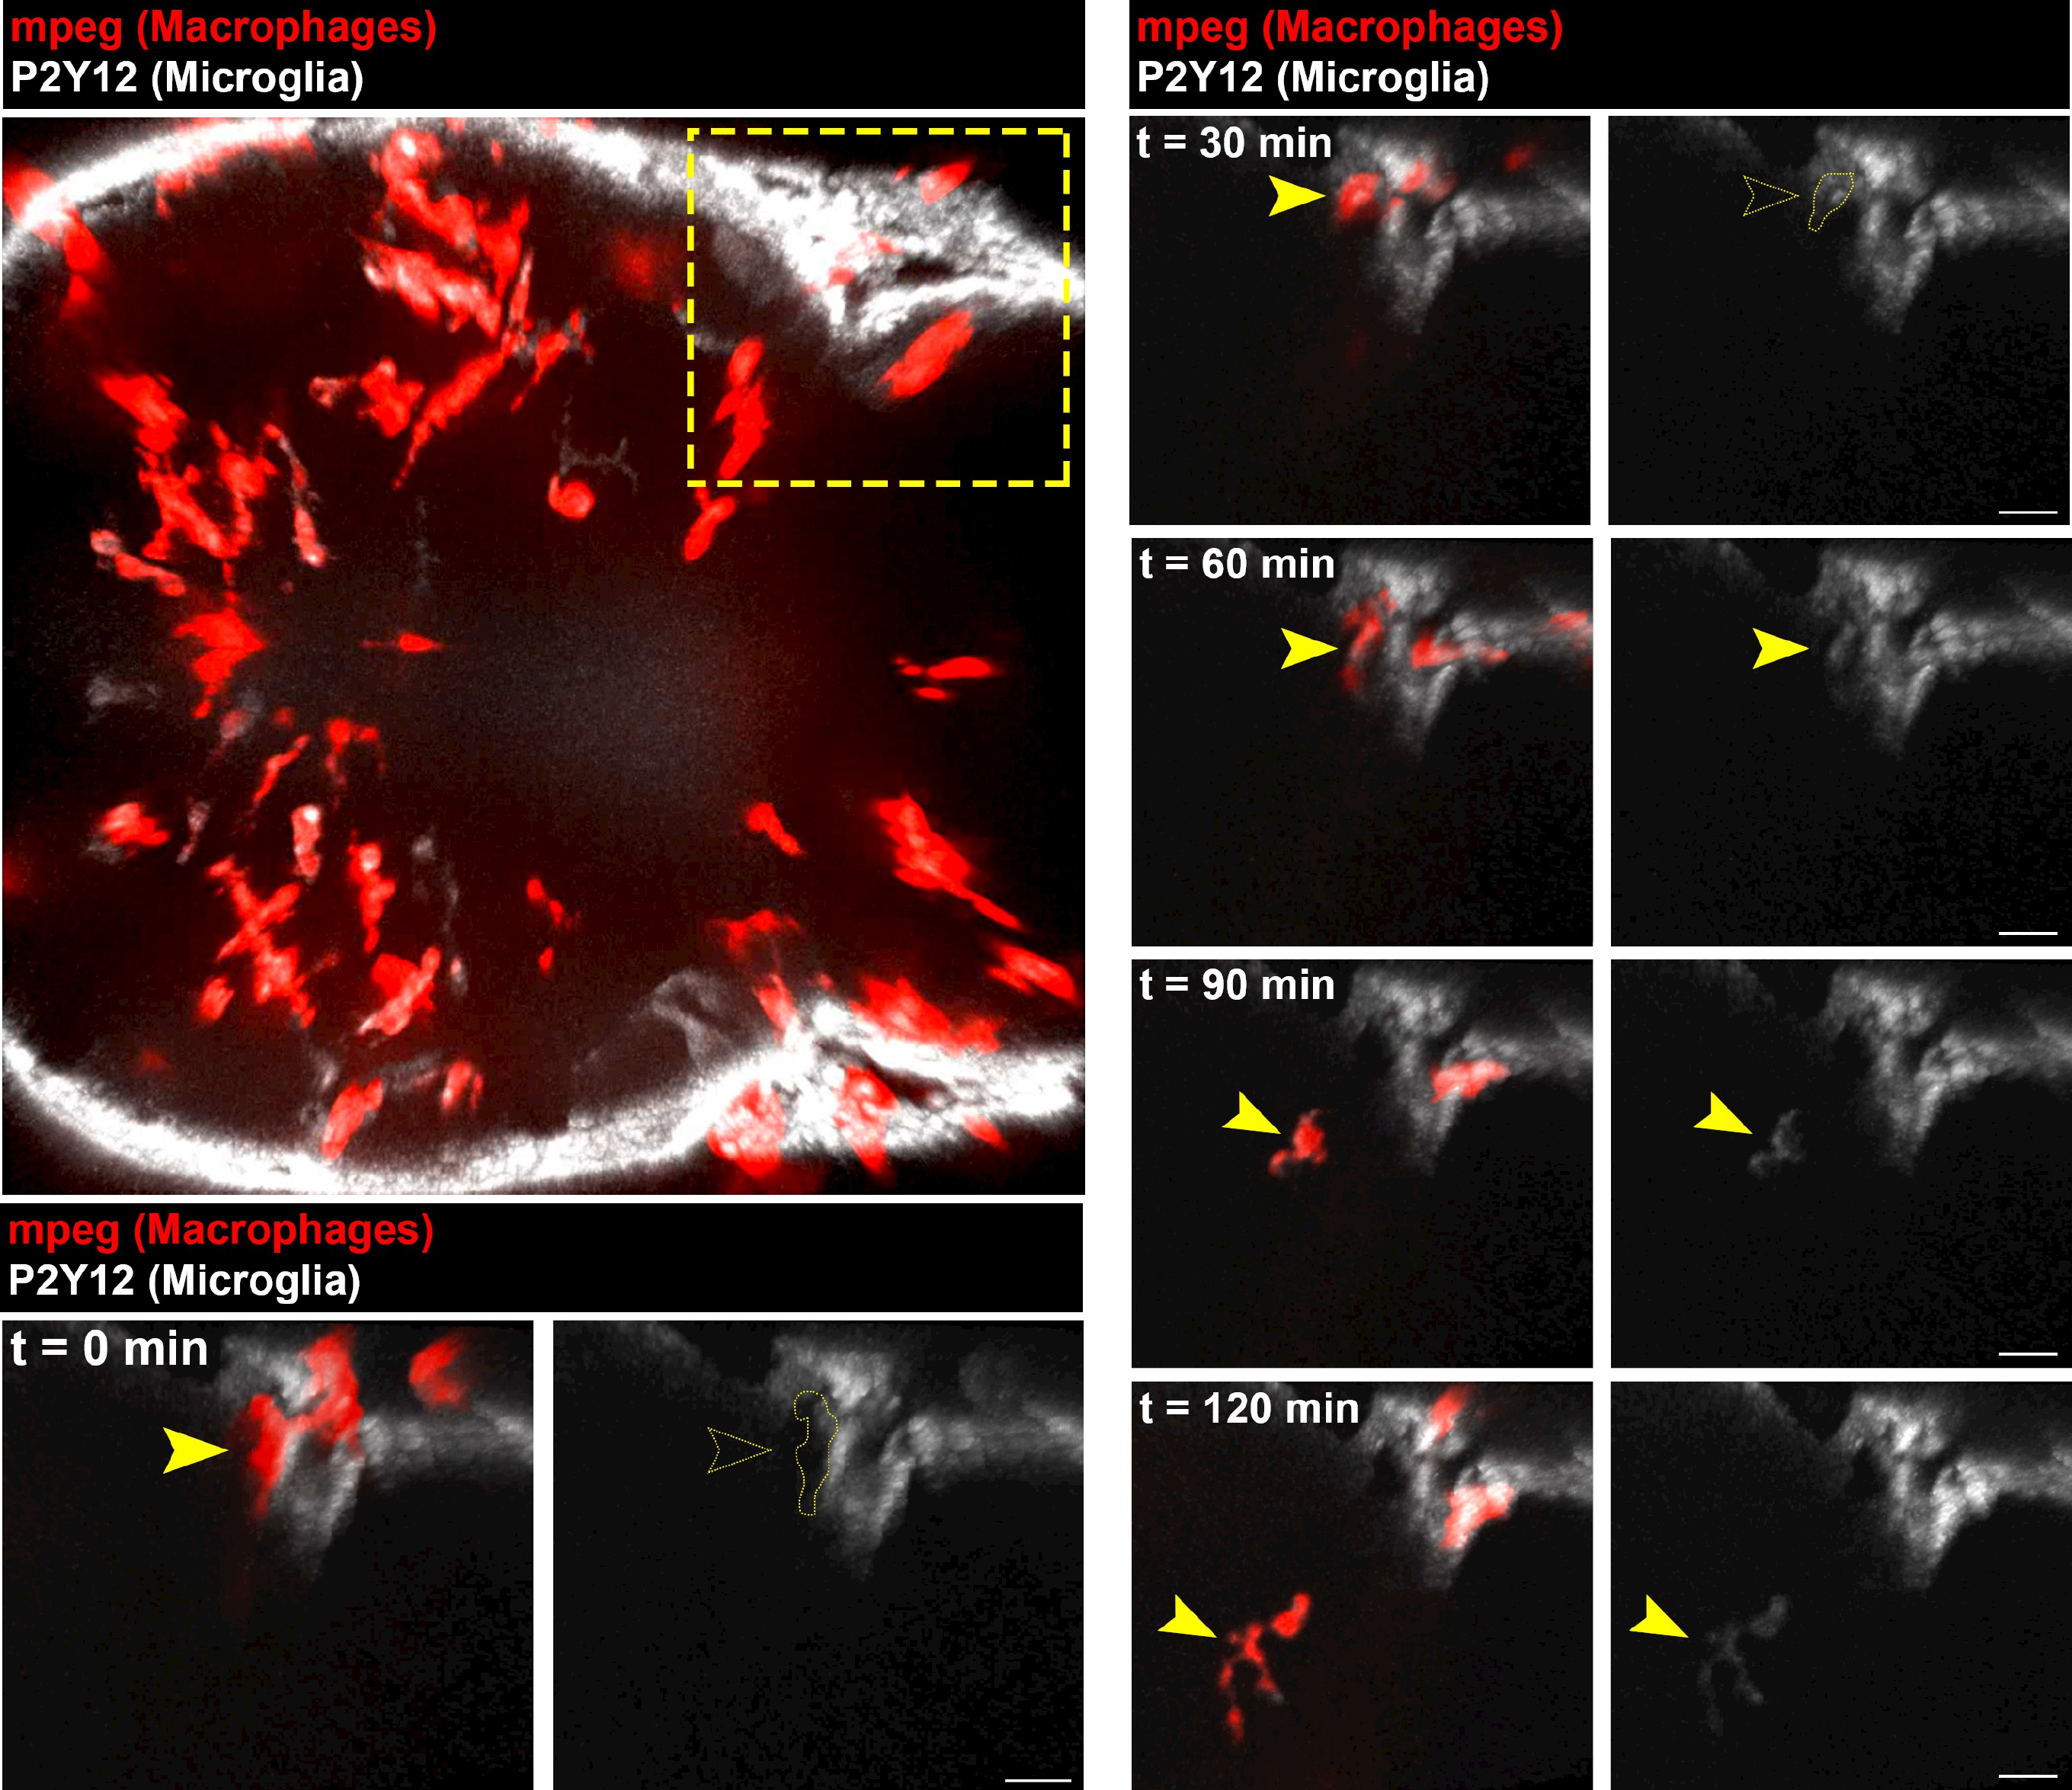
Macrophages infiltrate AKT1-positive brains and start expressing p2ry12.
The Tg(mpeg1:mCherry) line was outcrossed with the Tg(p2ry12:p2ry12-GFP) fish to create Tg(mpeg1:mCherry; p2ry12:p2ry12-GFP) double transgenic fish, in which all macrophages (including microglia) express mCherry under the mpeg1 promoter and microglia express in addition p2ry12-GFP under control of the p2ry12 promoter. Upon AKT1 overexpression, macrophages (red) were observed to infiltrate the brain and start to express p2ry12:p2ry12-GFP (white). In vivo time-lapse imaging was carried out over a period of 2 hr (126 min) at 5.5 dpf to observe macrophage infiltration into the brain parenchyma. Upper left image shows a dorsal view on the larval tectum and cerebellum, dashed yellow line highlights the area of infiltration, which is shown at different time points in higher magnification (recording times indicated). Dotted yellow line at t = 0 min and t = 30 min demarcates position of the mCherry-positive macrophage that is negative for P2ry12-GFP at these time points. Yellow arrowheads highlight the position of the infiltrating macrophage at all time points. See also Video 5. Images were captured using an Andor spinning disk confocal microscope with a 20X/NA 0.75 objective. Scale bars represent 10 Ám.

