
|
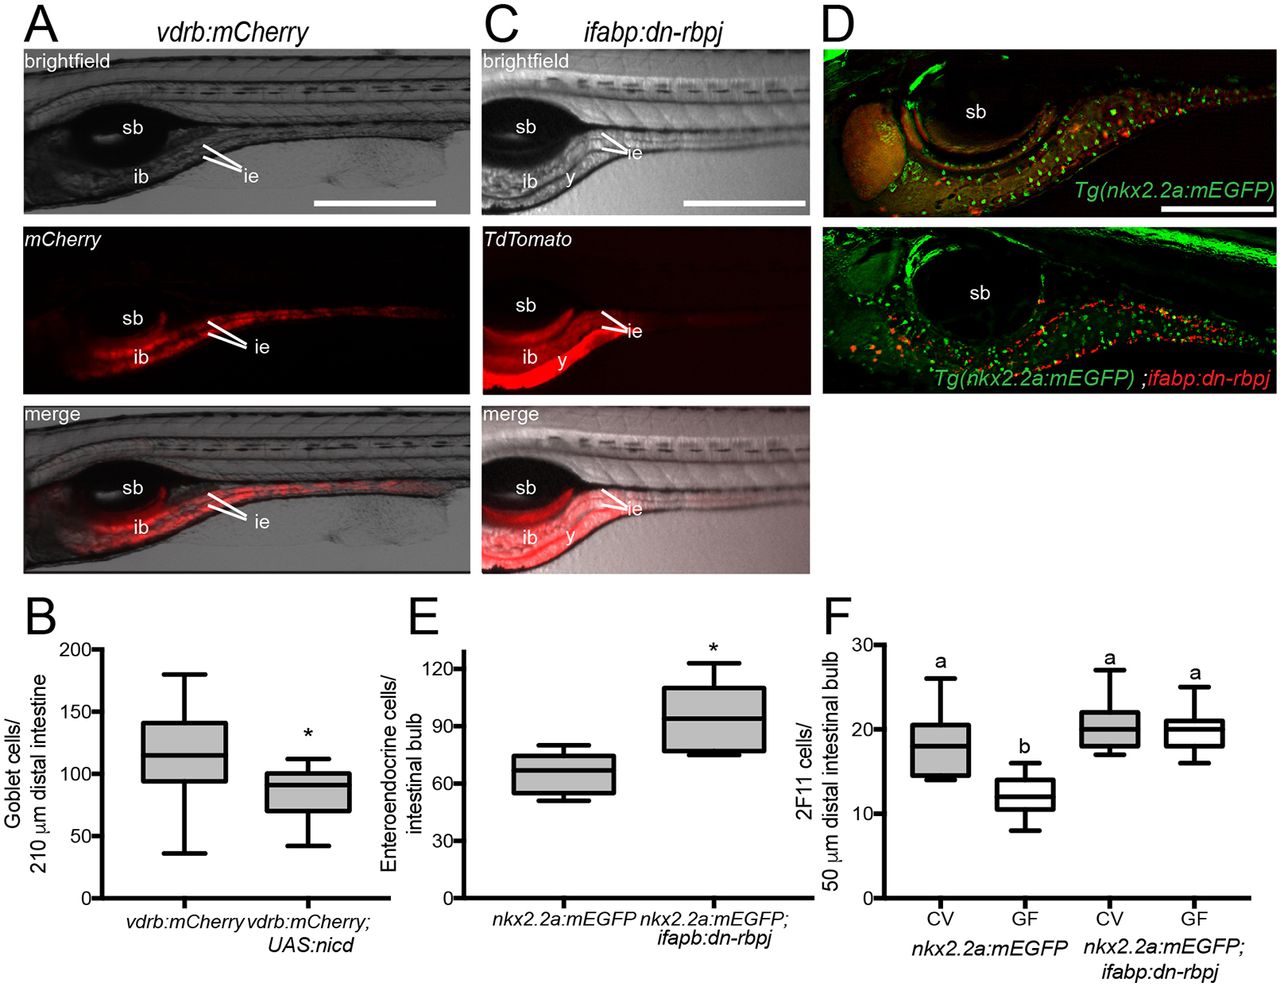
Fig. 2
Modulating Notch signaling within the intestinal epithelium is sufficient to alter secretory cell numbers. (A) Expression of Tg(vdrb:GAL4); Tg(UAS:mCherry); (vdrb:mCherry) with brightfield, fluorescence and merged signals; vdrb:GAL4 is expressed throughout the intestinal epithelium. (B) Number of goblet cells in vdrb:mCherry and vdrb:mCherry; Tg(UAS:nicd) zebrafish. n=23 (vdrb:mCherry), 10 [vdrb:mCherry; Tg(UAS:nicd)]. (C) Expression of ifabp:dn-rbpj with brightfield, fluorescence and merged signals; note that ifabp drives expression primarily in posterior intestinal bulb and proximal intestine. (D) Representative images of Tg(nkx2.2a:mEGFP) and Tg(nkx2.2a:mEGFP) crossed with ifabp:dn-rbpj to determine the effect of modulating Notch on EECs (green) in regions in which Notch signaling is augmented or suppressed (red). (E) Number of EECs in ifabp:dn-rbpj larvae; n=5 [Tg(nkx2.2a:mEGFP)], 7 [Tg(nkx2.2a:mEGFP); ifabp:dn-rbpj]. (F) Quantification of 2F11-positive secretory cells in CV and GF Tg(nkx2.2a:mEGFP) and Tg(nkx2.2a:mEGFP); ifabp:dn-rbpj larvae; n=17 for each condition. ib, intestinal bulb; ie, intestinal epithelium; sb, swim bladder; y, yolk. *P<0.05, Student's t-test. Letters denote P<0.05, ANOVA followed by Tukey's post-hoc test. Each box represents the first to third quartiles, center bar the median, and whiskers the maximum and minimum of each dataset. Scale bars: 500?�m (A,C); 250?�m (D).