
|
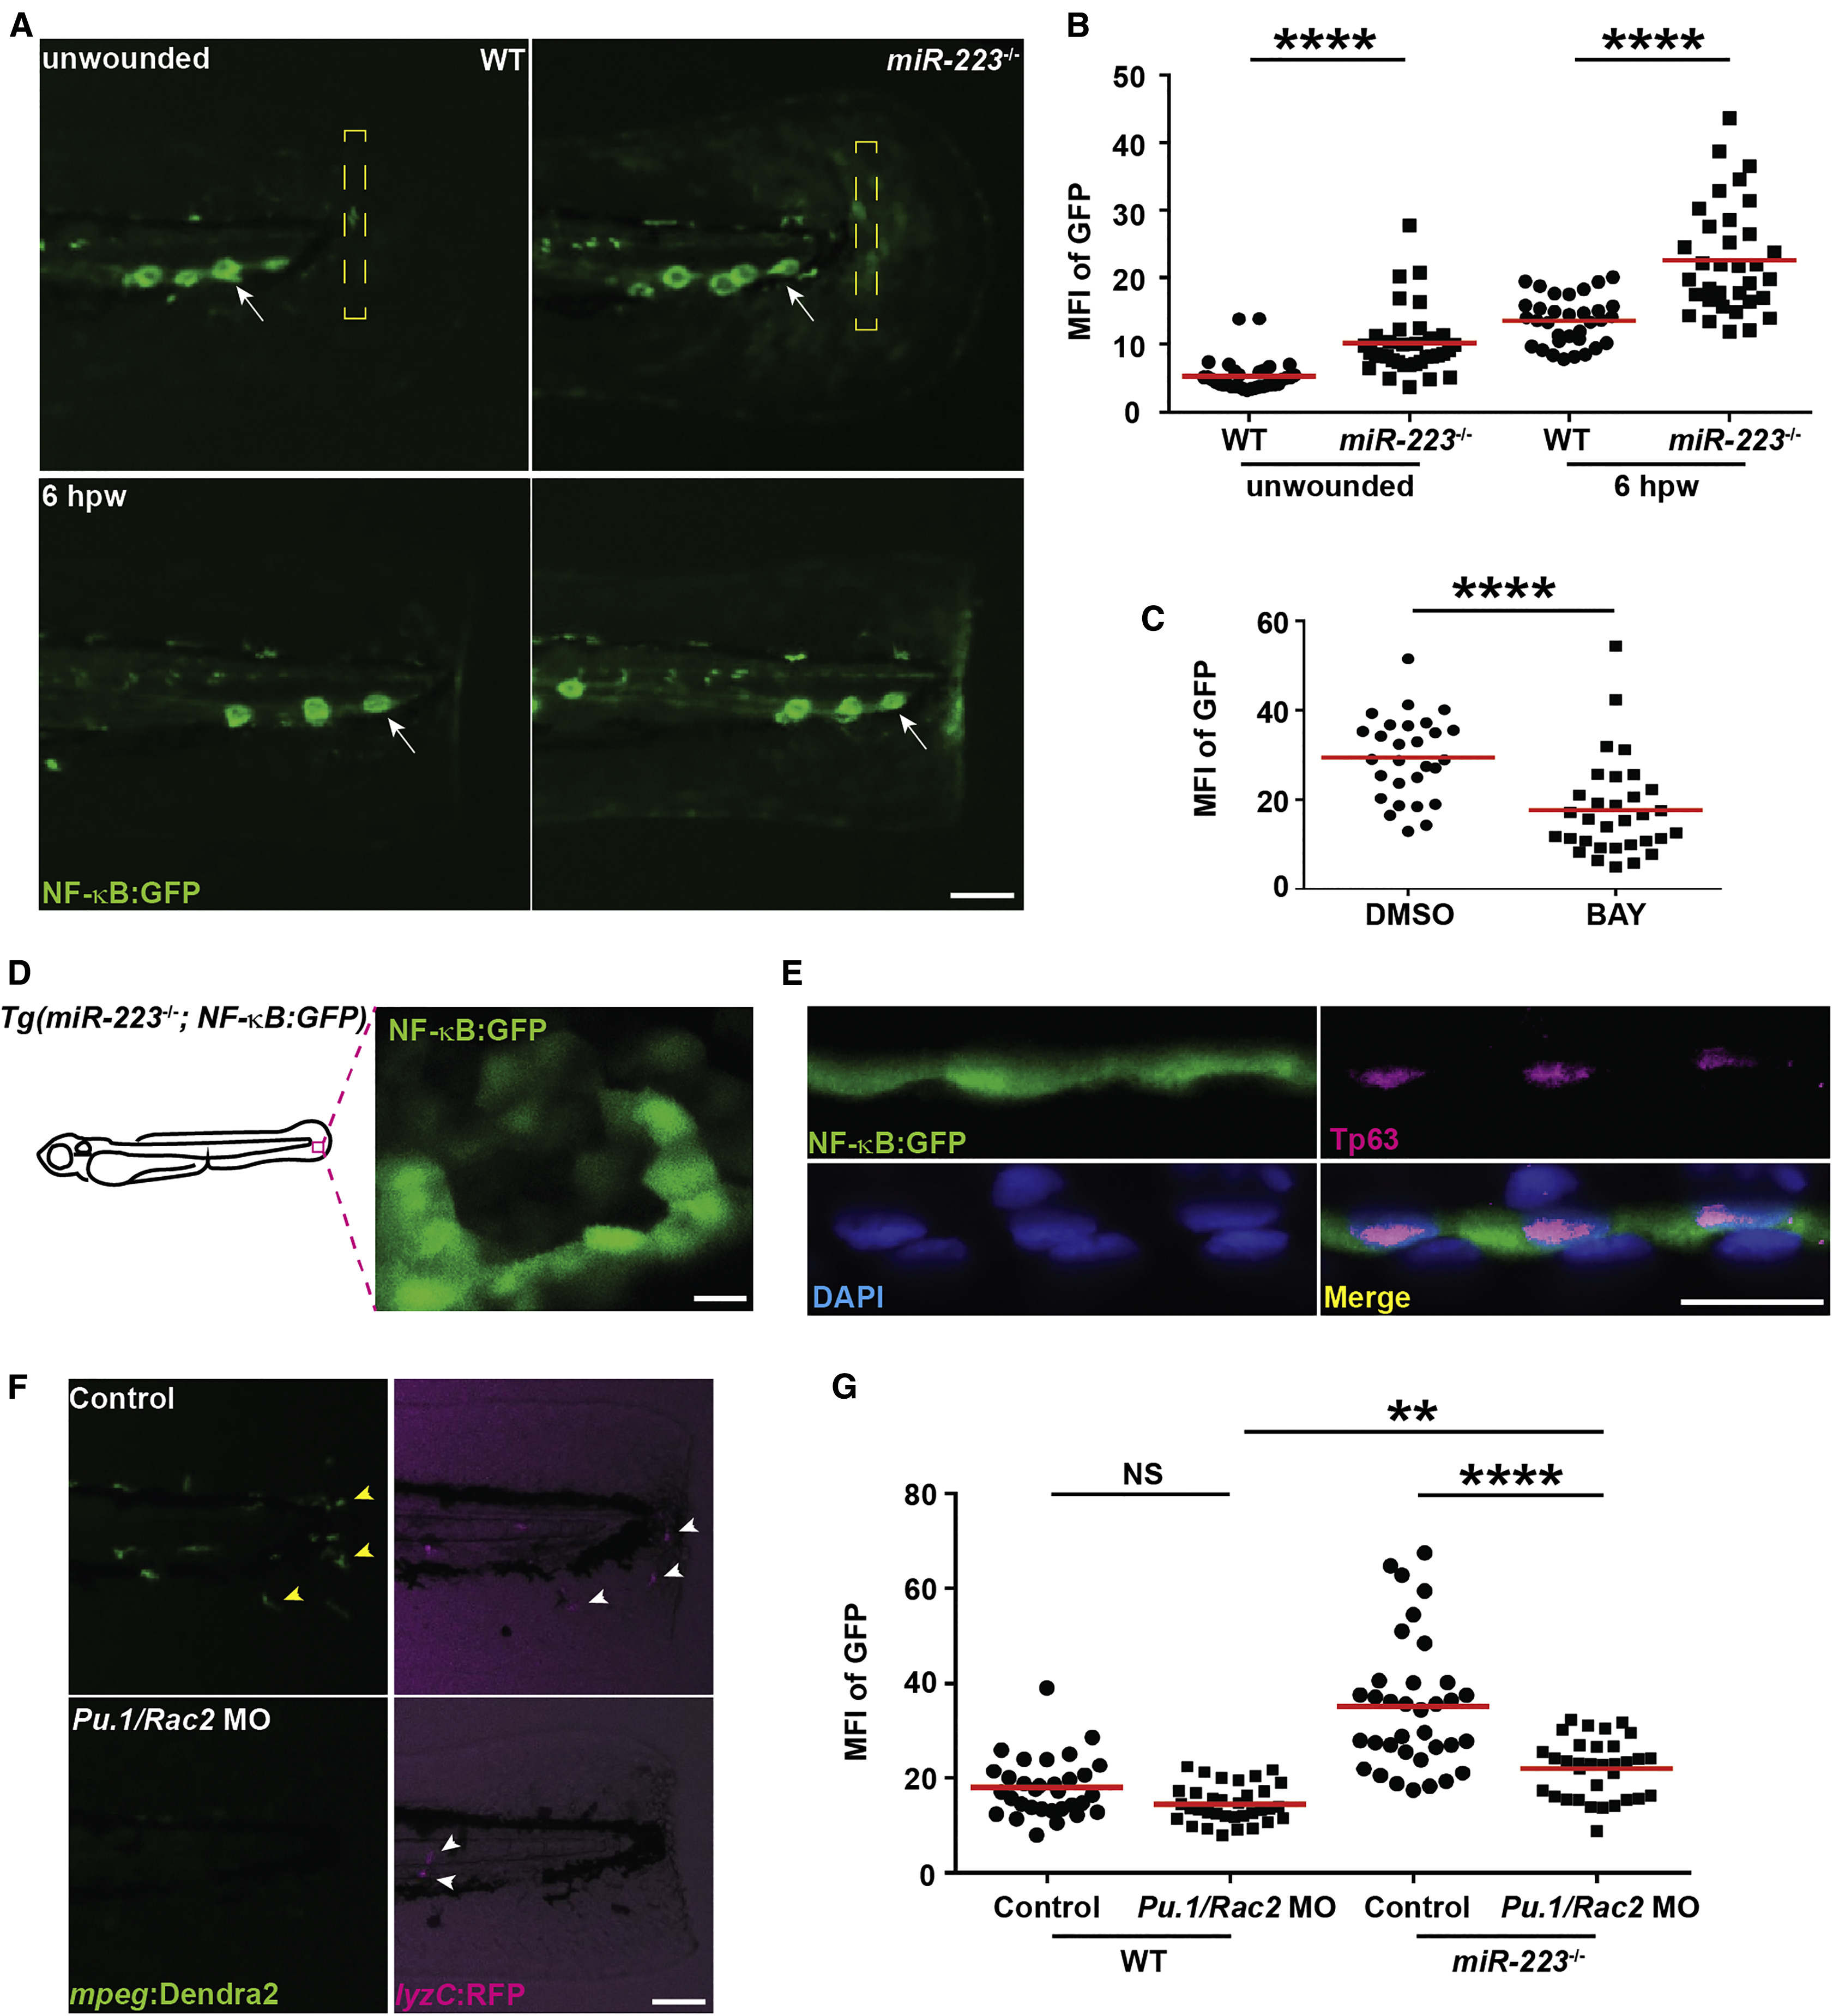
Fig. 4
NF-?B Pathway Is Elevated in Basal Epithelial Cells in miR-223?/? Embryos
The NF-?B reporter line Tg(NF-?B:GFP) was crossed into the miR-223?/? and matched WT background.
(A and B) Representative images (A) and quantification (B) of GFP signal. Mean fluorescence intensity (MFI) in the yellow square (A) in unwounded embryos or at the wound edge at 6 hpw was quantified. White arrows, neuromast cells constitutively expressing NF-?B signal.
(C) Quantification of GFP signal at the wound edge at 6 hpw in miR-223?/? embryos treated with DMSO or BAY.
(D) Representative confocal image of GFP+ cells in miR-223?/? embryos.
(E) Immunofluorescence of GFP and Tp63 (basal cell marker) in Tg(miR-223?/?, NF-?B:GFP) embryos. Nucleus were stained with DAPI. Representative confocal images of vertical view are shown in (E).
(F and G) Embryos from WT and miR-223?/? were injected with Pu.1 (200 ?M) and Rac2 (100 ?M) morpholinos. (F). Representative images showing the efficiency of the two morpholinos. Yellow arrowhead, macrophage; white arrowhead, neutrophils.
(G) Quantification of GFP signal at the wound edge at 6 hpw in WT and miR-223?/? embryos.
Scale bars, 100 ?m (A and F), 20 ?m (D and E). Data are representative of three independent experiments. ??p < 0.01 and ????p < 0.0001, unpaired Student?s t test (B and C) or two-way ANOVA (G). See also Figure S6 and Movie S2.