
|
Fig. S3
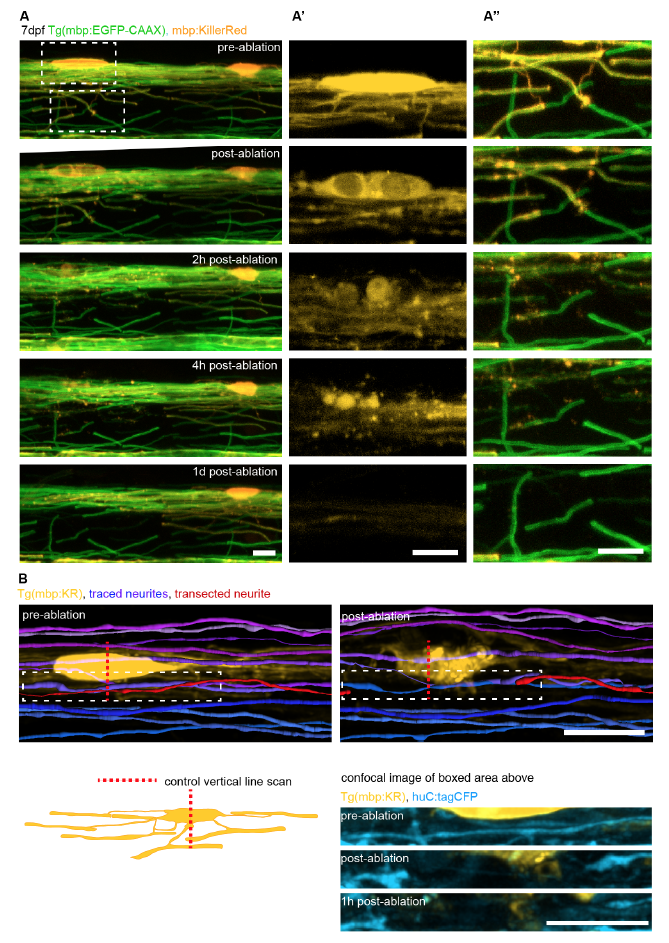
Characterisation of oligodendrocyte ablation. Related to Figure 5.
A) Time series of confocal images of mbp:KillerRed expressing cells in Tg(mbp:EGFP-CAAX) transgenic zebrafish at 7dpf before and at various time points after 2-photon bleaching of KillerRed-expressing cells. A? and A?? are zoom ins as indicated by the dashed boxes in A. Scale bar: 10?m. See also movie S1.
B) Axon reconstructions of huC:tagCFP labelled axons in Tg(mbp:KillerRed) zebrafish before and after oligodendrocyte ablation at 4dpf using vertical line scan as negative control as shown in the cartoon below. A transected axon is shown by the red trace. Bottom: Confocal images of the areas shown by the dashed box highlight the transected axon. Scale bar: 10?m.