
|
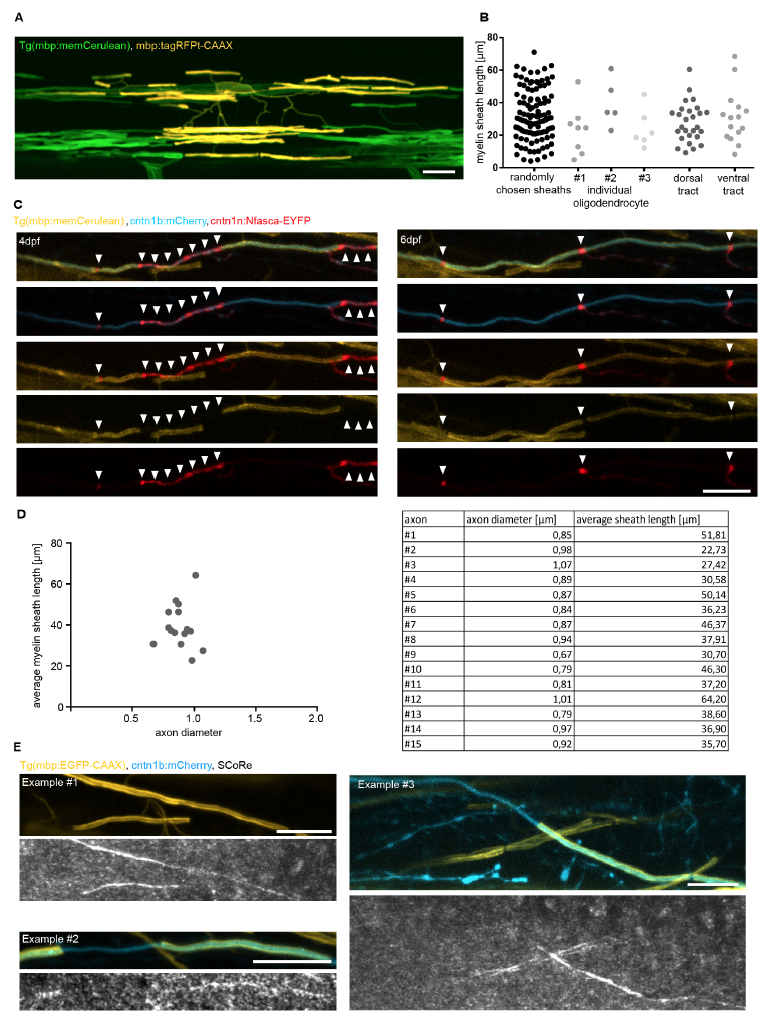
Fig. S1
Variability of sheath length, axon diameter of axons analysed, and validation of markers used. Related to Figure 1.
A) Confocal image of an individual mbp:tagRFPt-CAAX myelinating oligodendrocyte in the spinal cord of Tg(mbp:EGFP-CAAX) full transgenic zebrafish at 7dpf. Scale bar: 10?m.
B) Quantification of the length of randomly chosen myelin sheaths in Tg(mbp:EGFP-CAAX) at 7dpf, and the lengths of myelin sheaths formed by three different individual oligodendrocytes.
C) Confocal images of a spinal cord axon expressing cntn1b:mCherry and cntn1b:Nfasca-EYFP in Tg(mbp:memCerulean) full transgenic animals at 4dpf and 6dpf. Nfasca-EYFP only localises to axonal areas that are not covered with myelin and is diffusely expressed along longer non-myelinated axon stretches (arrowheads). Scale bar: 10?m.
D) Quantification of average sheath length along an individual axon relative to the diameter of the axon.
E) Confocal images of Tg(mbp:EGFP-CAAX) full transgenic zebrafish, individual cntn1b:mCherry labelled axons, and Spectral Confocal Reflectance (SCoRe) as label-free method to visualise myelinated axons. Scale bars: 10?m.