
|
Fig. 3
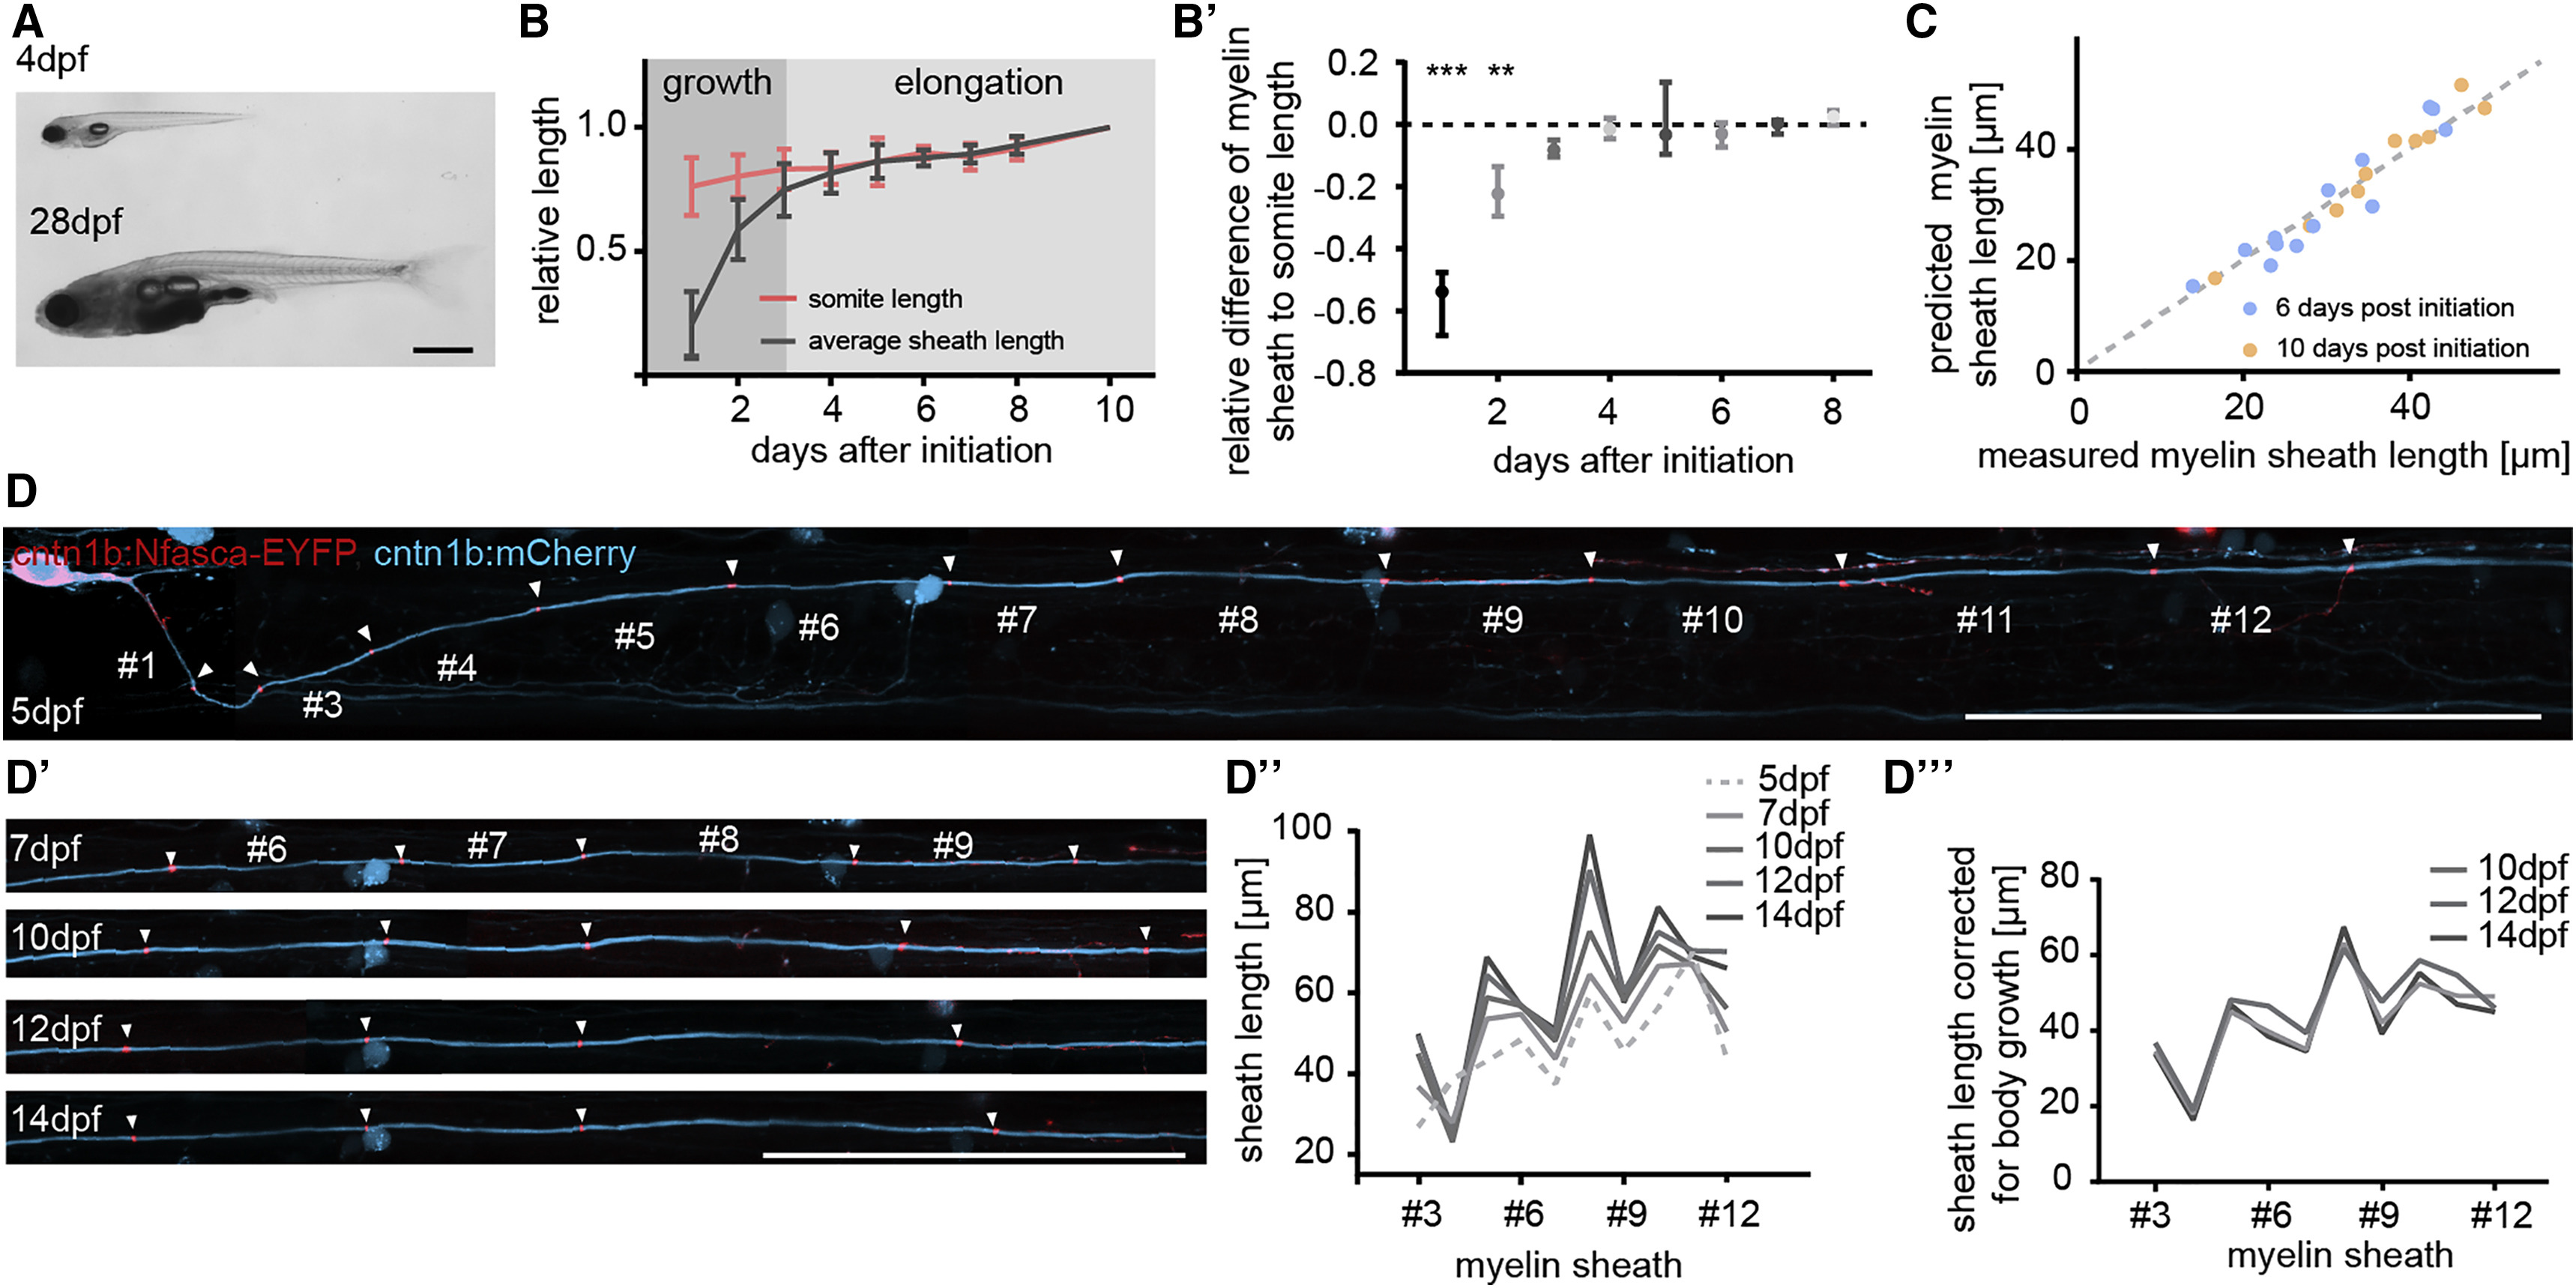
Long-Term Extension of Myelin Sheaths Compensates for Body Growth
(A) Photographs of zebrafish at 4 and at 28 days post-fertilization (dpf). Scale bar, 1 mm.
(B) Quantification of the relative increase of sheath length from their respective initiation onward compared to the increase in somite length over the same time. Data are expressed as mean � SD.
(B?) Quantification shown in (B) corrected for increase in body growth. Data are expressed as median with interquartile range (Wilcoxon signed-rank test).
(C) Correlation between measured sheath length and their predicted length using increase in somite size as a reference.
(D?D???) Timeline of confocal images of an individual cntn1b:mCherry, cntn1b:NFacsa-EYFP co-expressing neuron in the zebrafish spinal cord between 5 and 14 dpf. Scale bar, 100 ?m (D and D?).
(D?) Quantification of sheath lengths along the axon shown in (D) between 5 and 14 dpf.
(D???) Quantification shown in (D?) corrected for animal body growth.
See also Figure S2 and Movie S2.