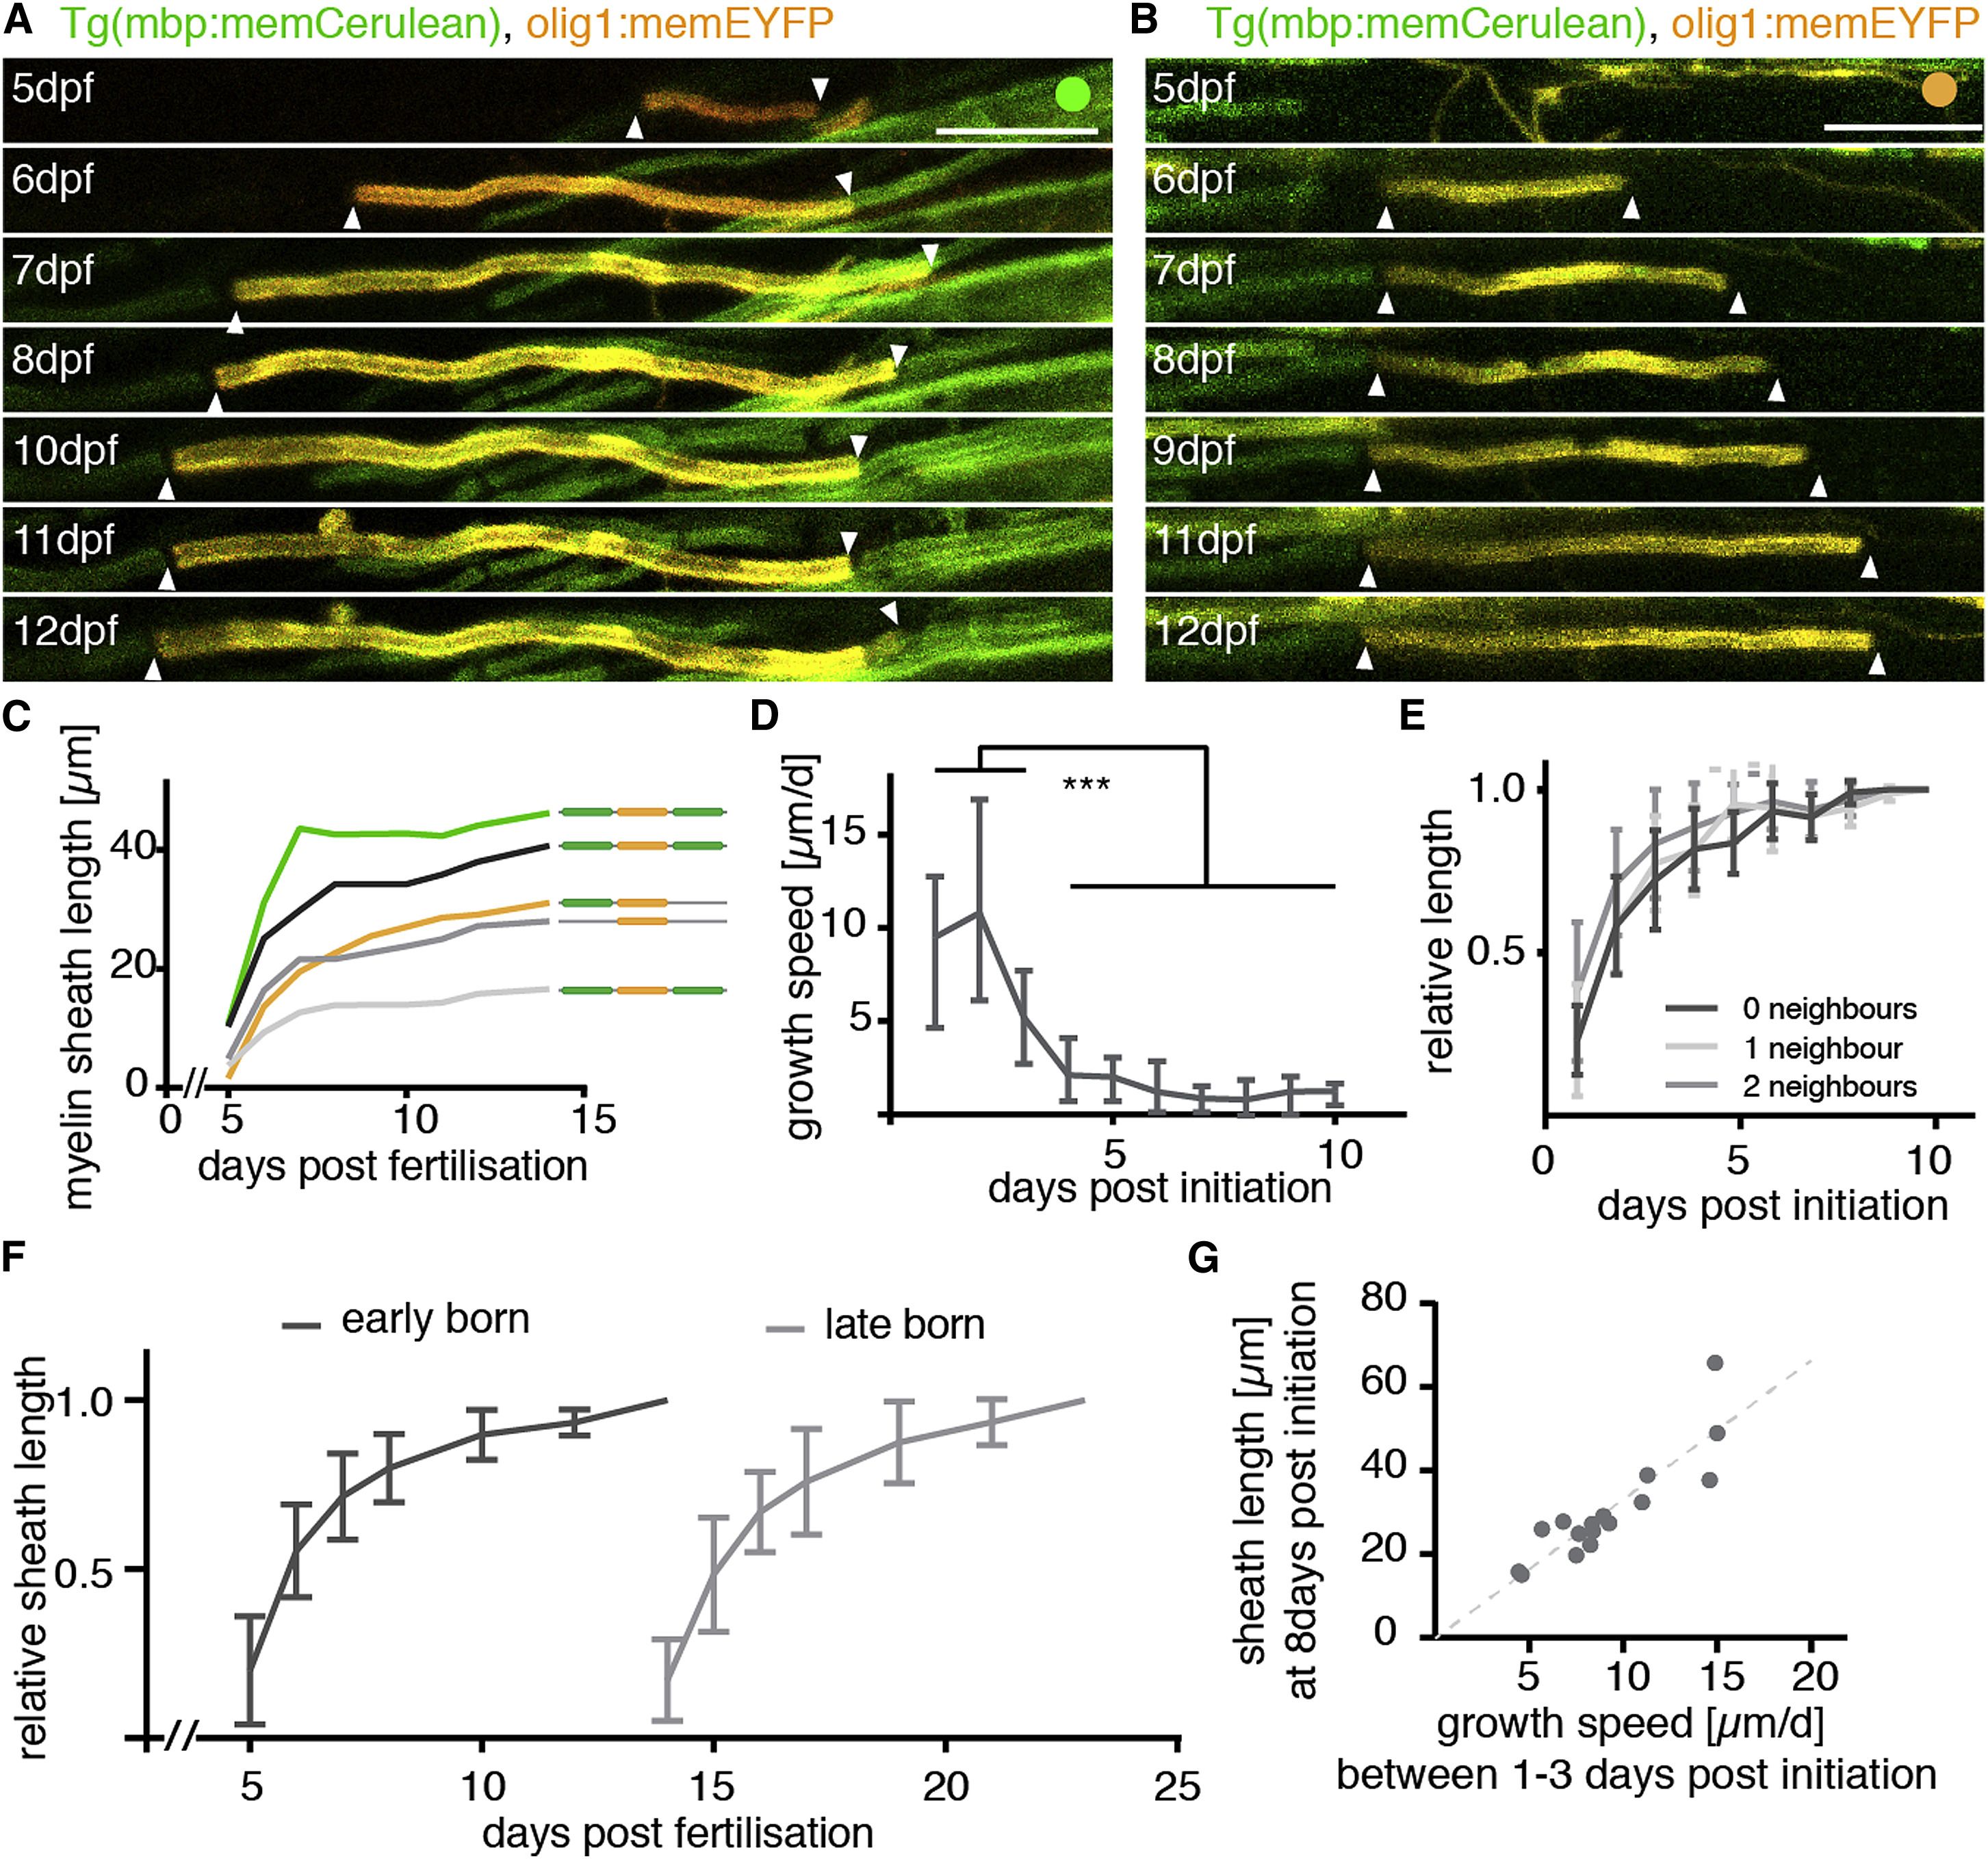
Fig. 2
Differences in Myelin Sheath Lengths Are Established within a Few Days after Their Initiation
(A) Timeline of confocal images of an olig1:memEYFP-labeled myelin sheath in a Tg(mbp:memCerulean) background between 5 and 12 days post-fertilization (dpf) getting flanked by two neighboring sheaths over the course of analysis (arrowheads). Scale bar, 10 ?m.
(B) Timeline of confocal images as in A showing an individual sheath flanked by only one neighbor (arrowheads). Scale bar, 10 ?m.
(C) Quantification of the length of five example sheaths between 5 and 14 dpf.
(D) Quantification of growth speeds of individual sheaths between 1 and 10 days post-initiation (dpi). Data are expressed as median with interquartile range (Wilcoxon matched-pairs signed-rank test, p < 0.001).
(E) Quantification of the relative length increase of sheaths with two, one, or no neighboring sheath by the end of analysis. Data are expressed as mean ± SD.
(F) Quantification of the relative length increase of sheaths initiated at 5 and 14 dpf, respectively. Data are expressed as mean ± SD.
(G) Correlation of sheath growth speed from 1 to 3 dpi with its length at 8 dpi.
See also Figure S2 and Movies S1 and S2.

