Fig. 8-S1
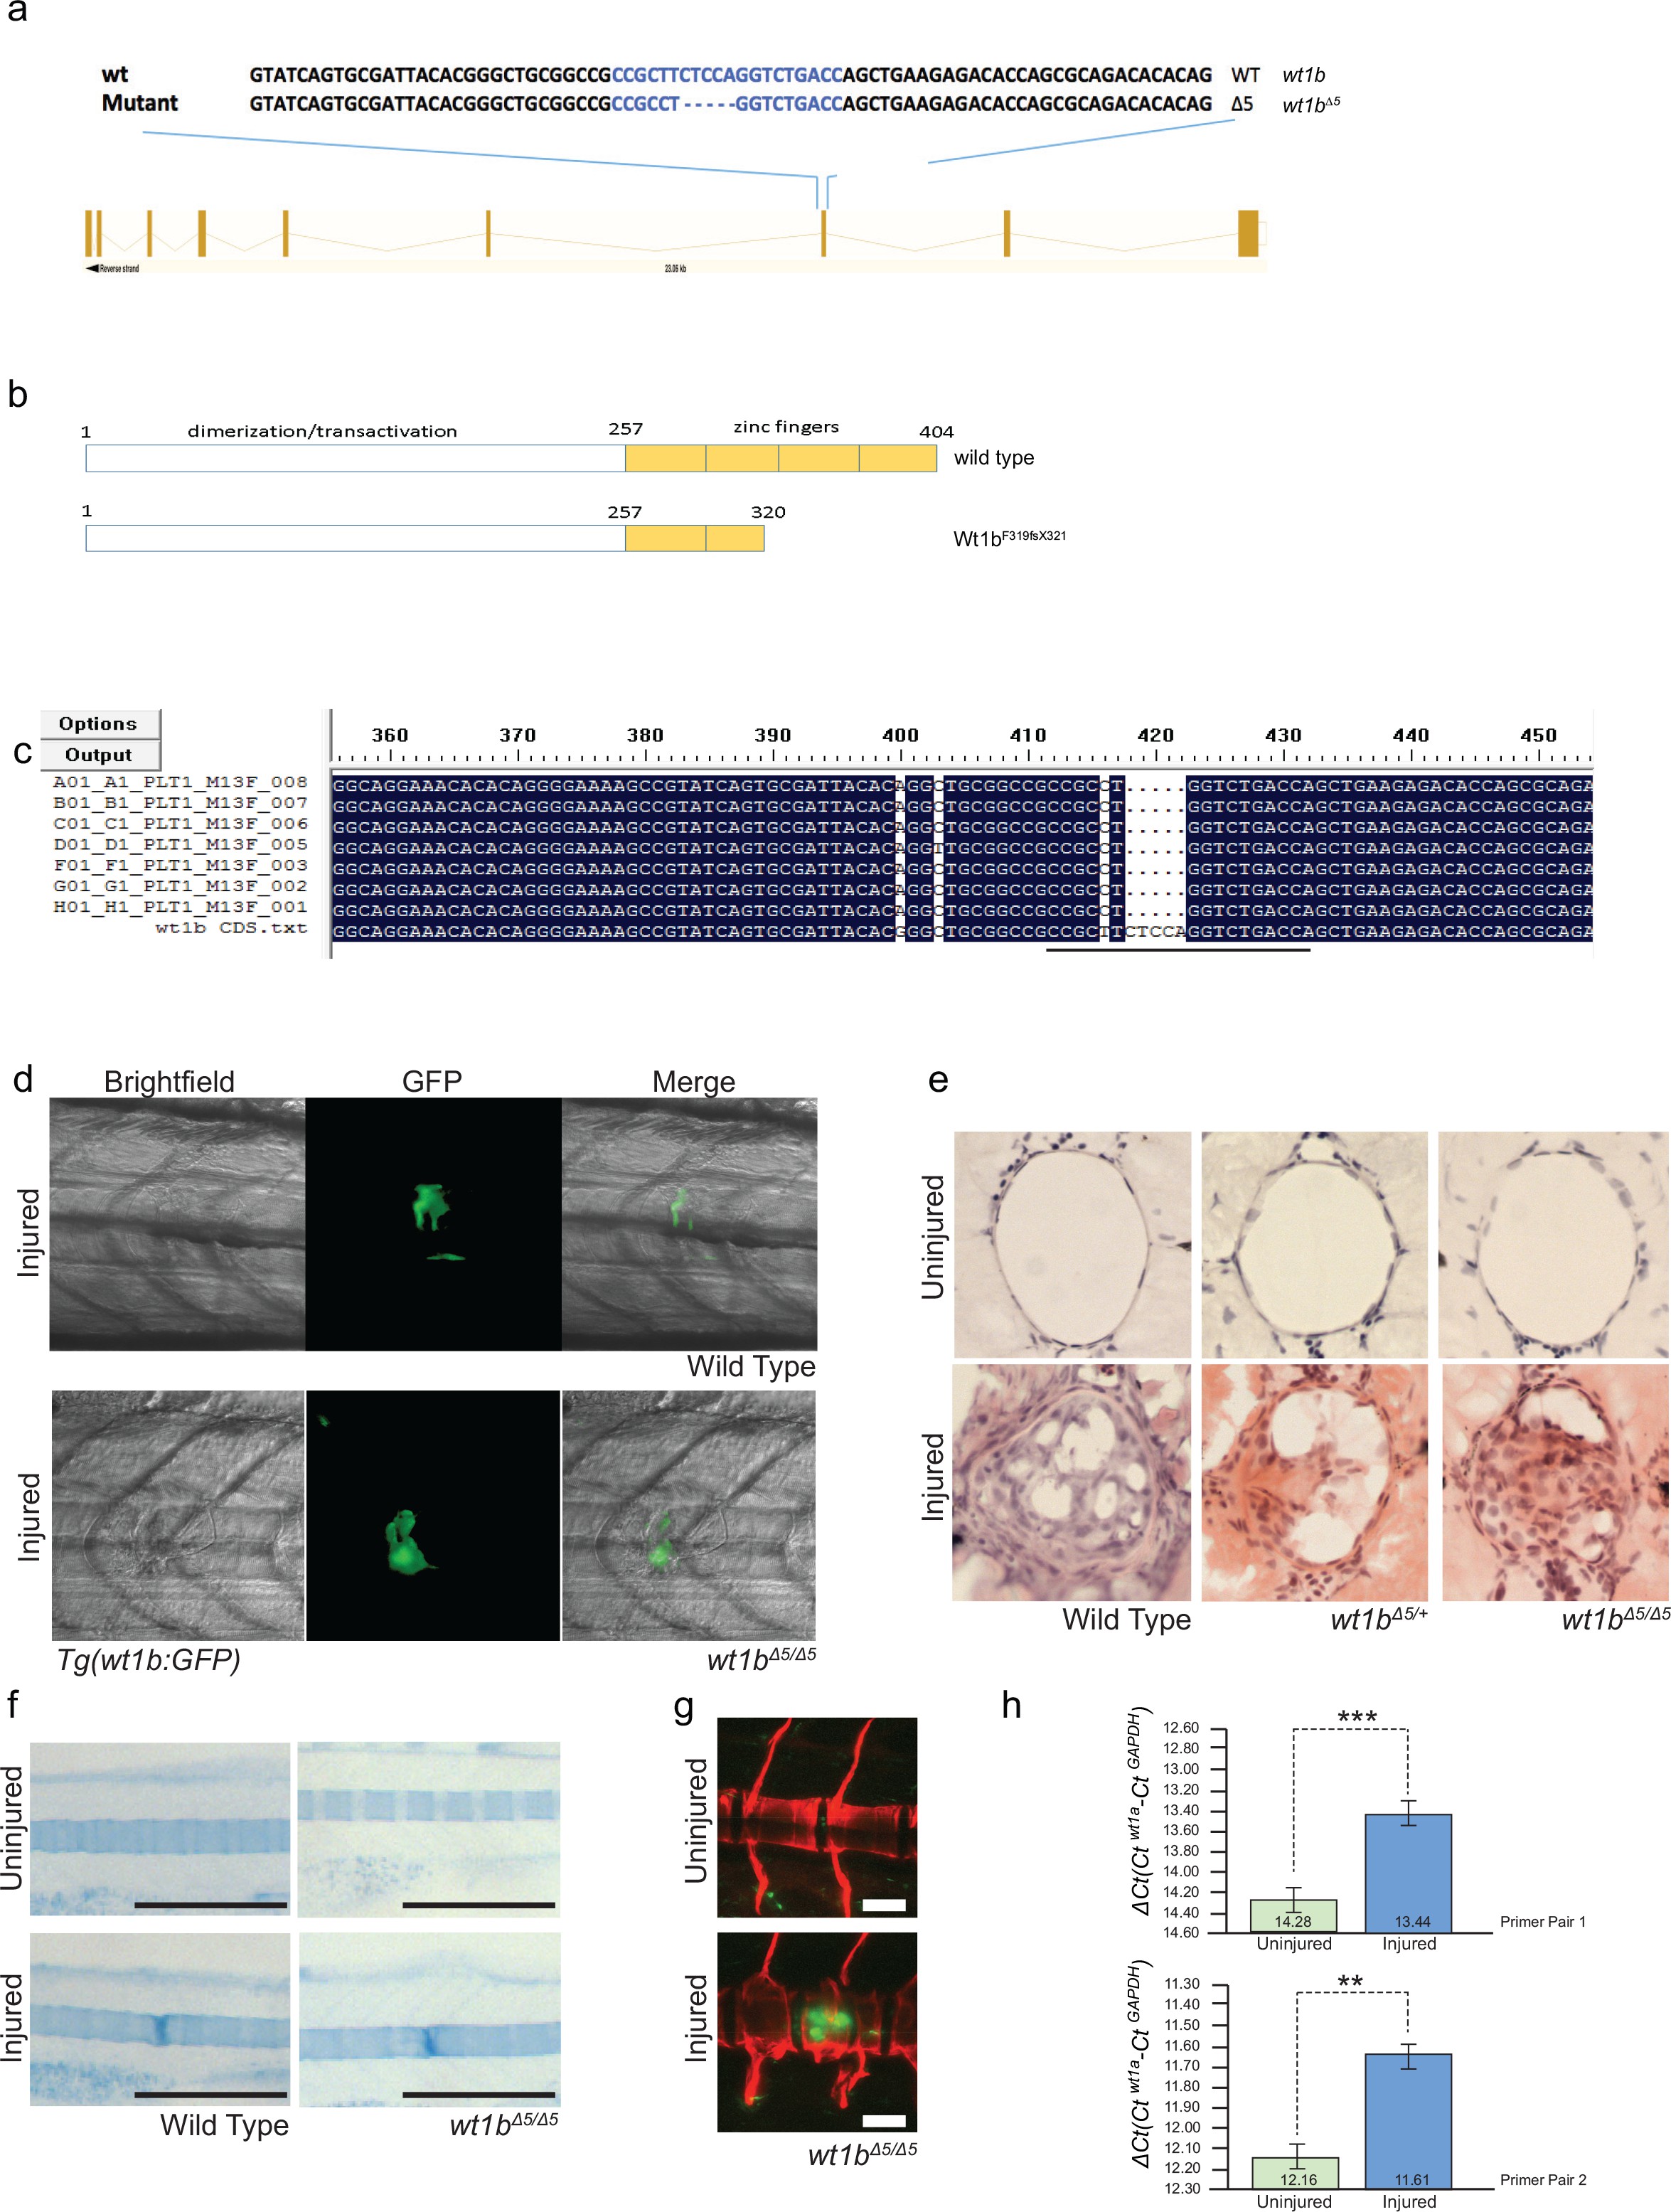
Generation of wt1b mutant zebrafish.
(a) Schematic showing the mutation induced by CRISPR/Cas9 in exon 7 of the wt1b gene and detailed sequence change in the mutant allele. The gRNA target sequence is depicted in blue and the mutation is 5 bp deletion within the 20 bp gRNA target. (b) Schematic showing predicated change in mutant Wt1b protein. Wt1b protein consists of a dimerization/transactivation domain in the N-terminus and four zinc finger domains in the C-terminal end of the protein. The 5 bp deletion in the wt1b gene results in a premature stop codon at amino acid 319, leading to a stop codon at 321 (F319fsX321). Numbering refers to amino acid number. (c) Confirmation of the mutation in wt1b mRNA from wt1b CRISPR mutant fish. Total RNA was prepared from homozygous wt1b CRISPR mutant embryos (3dpf), RT-PCR was performed to amplify the region covering the mutation. The PCR product was cloned into the pCR2.1TOPO vector and TA clones were sequenced with the M13 +primer. Sequences of TA clones were compared to wild type wt1b cDNA sequence by DNA alignment. All seven PCR fragments contain the 5 bp deletion (represented as dots). The 20 bp target sequence of guide RNA is underlined. (d) Images of Tg(wt1b:gfp); casper zebrafish trunk 3dpi following notochord needle injury in wild type and homozygous wt1b?5/?5 sibling controls. n > 5; experimental replicates >2. (e) H and E staining of histological sections of zebrafish notochord (cross section) 3dpi following notochord needle injury in wild type and homozygous wt1b?5/?5 sibling controls. n > 3; experimental replicates = 1. H and E: haematoxylin and eosin. (f) Alcian blue staining of wild type and wt1b?5/?5 larvae shows increased staining of vertebrae at the site of injury. Scale bar 500 Ám. (g) Confocal scans of 24 dpi Tg(wt1b:GFP);wt1b?5/?5 larvae stained with alizarin red and expressing GFP at the injury site following notochord injury. GFP positive cells are present within the vertebrae at the injury site (lower panel) but not in other vertebrae in uninjured fish (top panel). Scale bar: 100 Ám. (h) Results of quantitative real-time PCR (qRT-PCR) of wt1a with two different sets of primers (1 and 2). The y-axis indicates the difference between the cycle threshold (Ct) value of the gene of interest (wt1a) and the Ct value of gapdh in each sample. Note that the y-axis is inverted to ease interpretation. Bars represent standard deviation from the mean. Paired t-test. Primer set 1, ***p=0.001; Primer set 2, **p=0.009. paired t-test; Experimental replicates = 1 biological sample from 40 embryos pooled, tested with two independent primer sets. See Source Data file (Figure 8?figure supplement 1?source data 1).

