
|
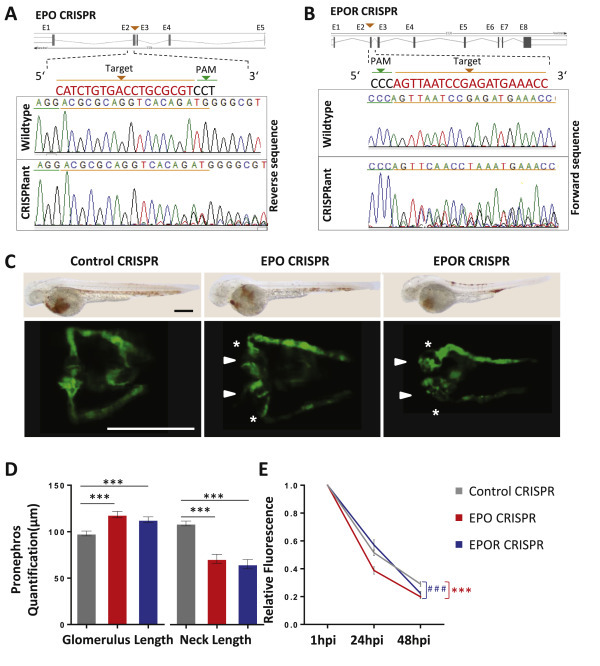
Fig. 4
EPO and EPOR CRIPSRants phenocopies EPO and EPOR morphants in zebrafish. A, B. Schematic illustration of EPO and EPOR CRISPR target regions and sequence results of wildtype, EPO CRISPRant, and EPOR CRISPRants. C. Similar to morphants, EPO CRISPR, and EPOR CRISPR injected zebrafish embryos (EPO CRISPR and EPOR CRISPR) also showed an enlarged glomerulus (white arrow head) and a highly shortened pronephric neck (white asterixis) at 48 hpf in TG(WT1B:EGFP) zebrafish embryos. Light microscopy images above show strongly reduced hemoglobin concentrations using O-dianiside stain in EPO CRISPR and EPOR CRISPR injected zebrafish embryos as compared to Control CRISPR injected embryos at 48 hpf indicating efficient knockout of both genes. D. Quantification of data shown in C in three independent experiments for each group. (n = 43?47 embryos per group). E. Increased loss of intracardiac injected 70 kDa dextran?FITC at 24 hpi and 48 hpi in EPO CRISPR and EPOR CRISPR injected zebrafish embryos as compared to its respective control performed in three independent experiments. (n = 40?48 embryos per group). All data were analyzed using the Student?s t-test. Mean � s.e.m. *** or ###p < 0.001.