
Fig. 2
|
Fig. 2
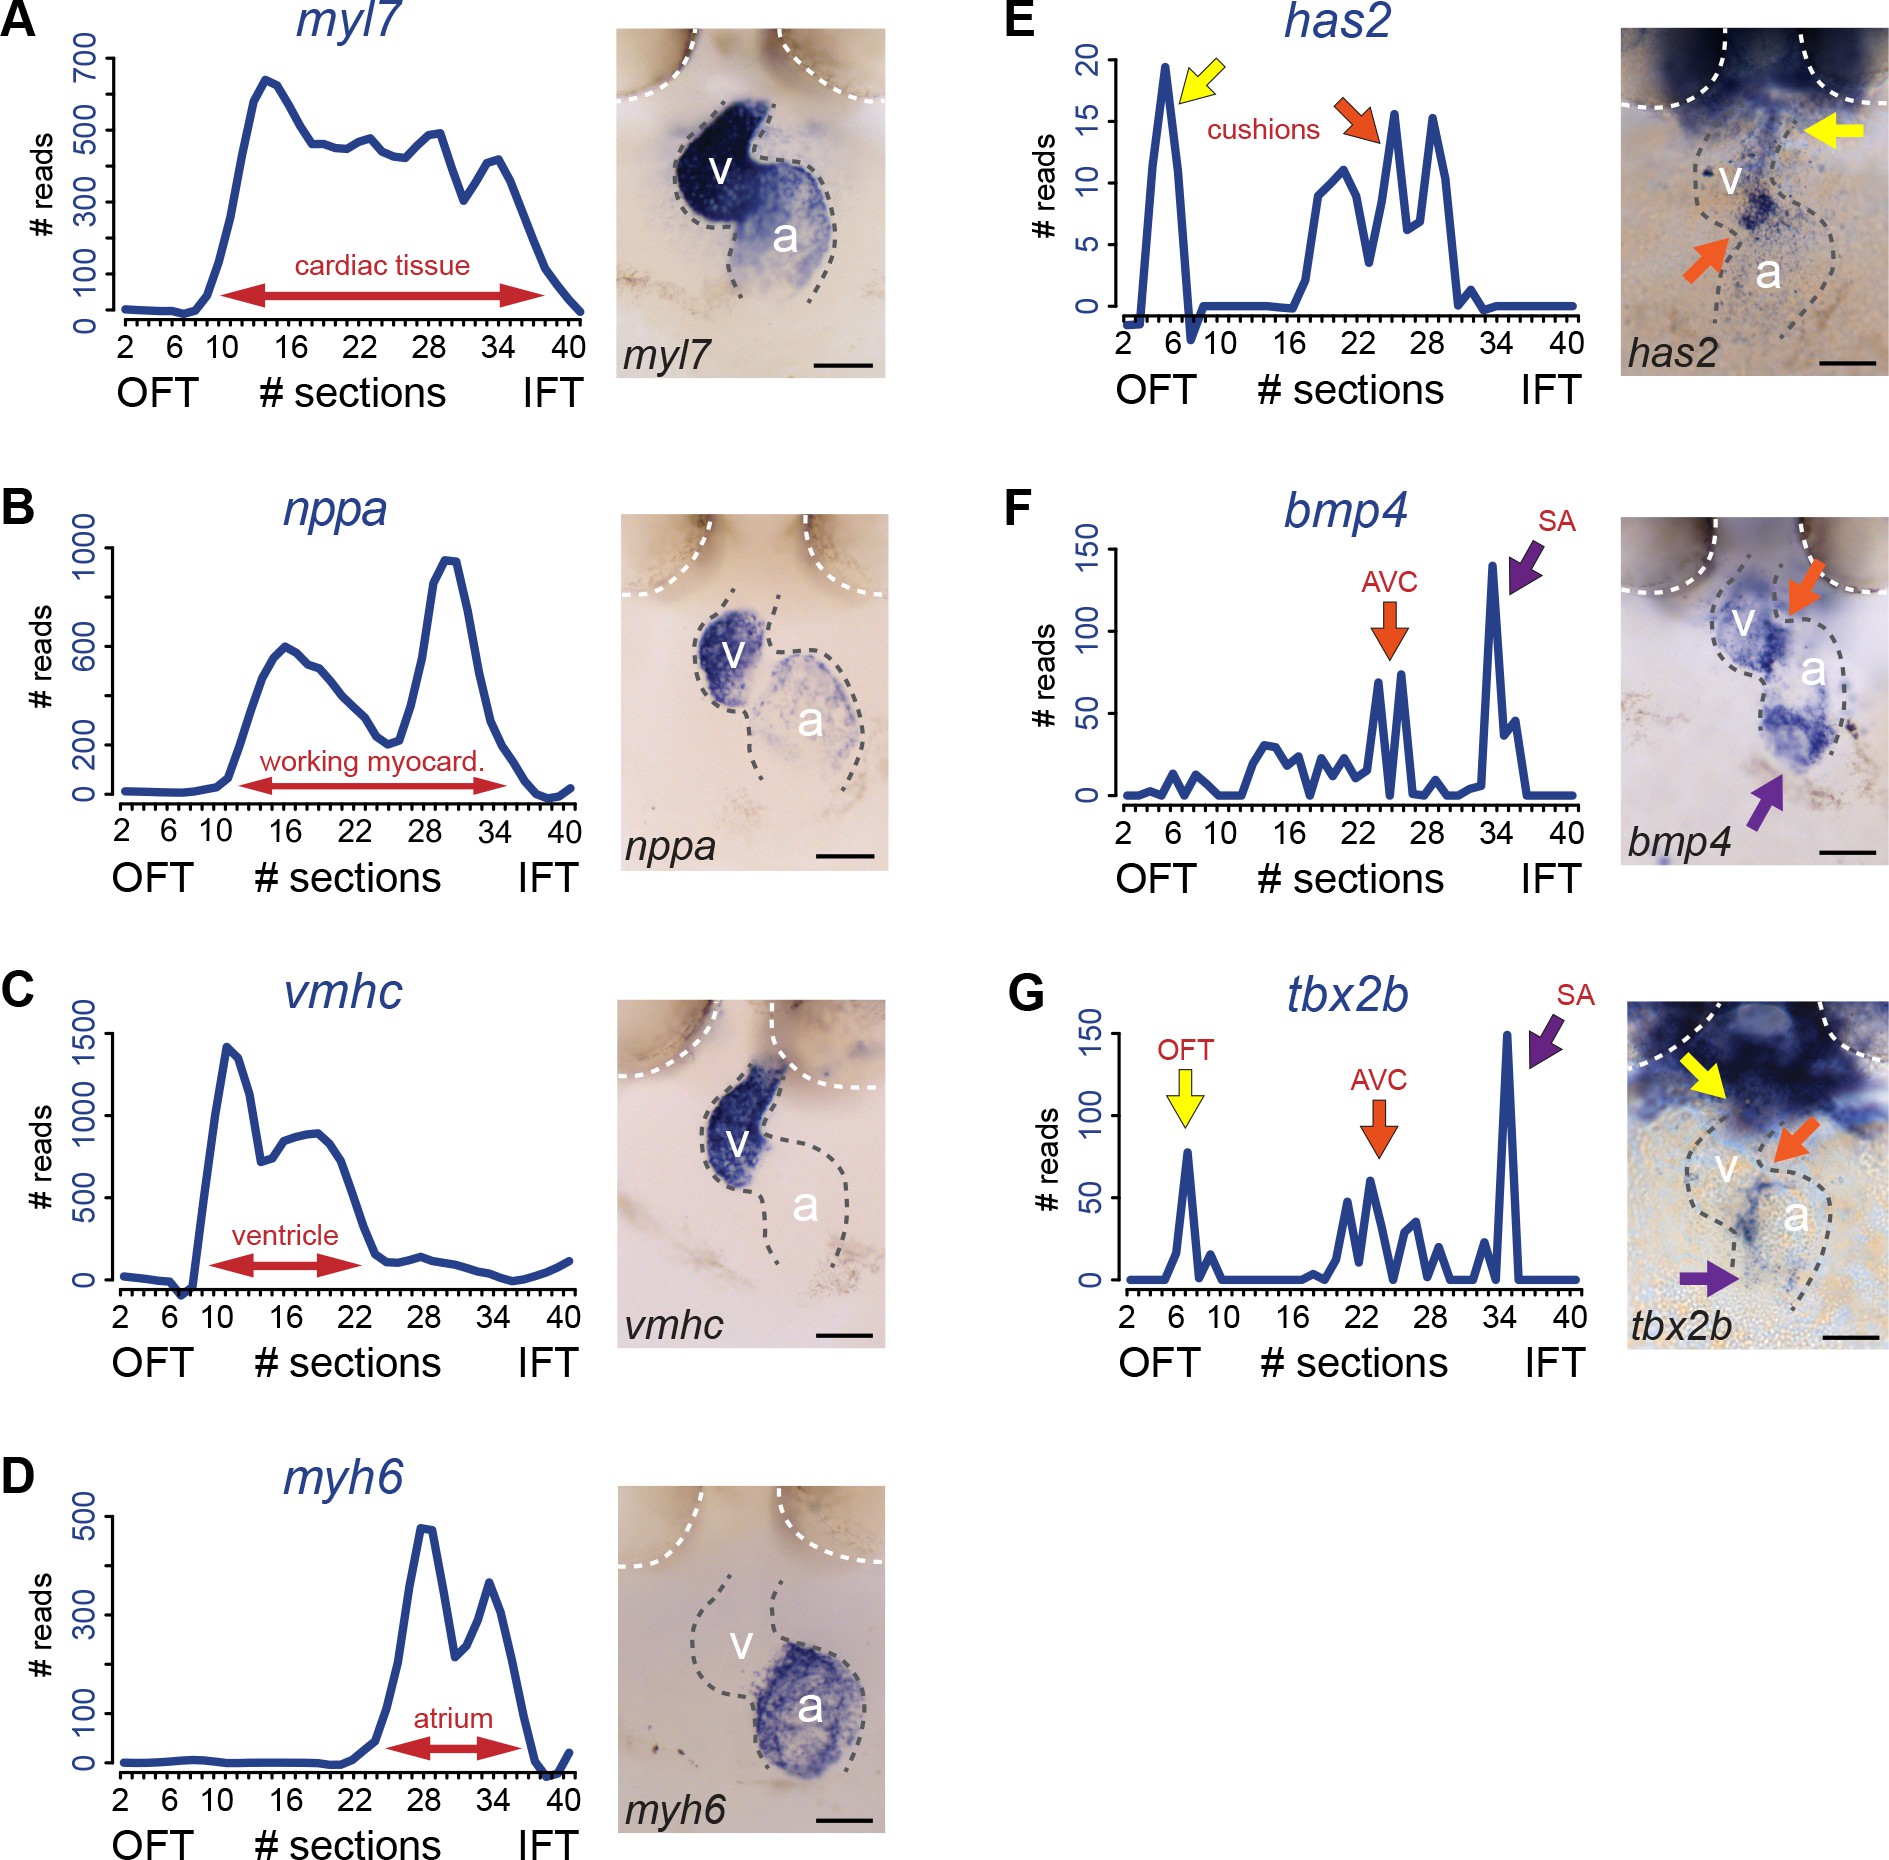
Transcriptome map of the embryonic heart with high spatial resolution.
(A?E) Tomo-seq expression traces and corresponding in situ hybridization for (A) myl7 (whole myocardium), (C) vmhc (ventricular myocardium), (D) myh6 (atrial myocardium), (E) has2 (endocardial cushions), (F) bmp4 (AVC myocardium, orange arrow; IFT myocardium, purple arrow) and (G) tbx2b (OFT myocardium, yellow arrow, AVC myocardium, orange arrow; IFT myocardium, purple arrow). Smoothening (LOESS) was applied to graphs A-E, span ? = 0.3. Anterior up. Gray dashed line outlines the heart. White dashed line outlines the eyes. A, atrium; V, ventricle; AVC: atrioventricular canal; IFT, inflow tract; OFT, outflow tract; SA, sinoatrial region. Scale bars represent 50 ?m.