
|
Fig. S16
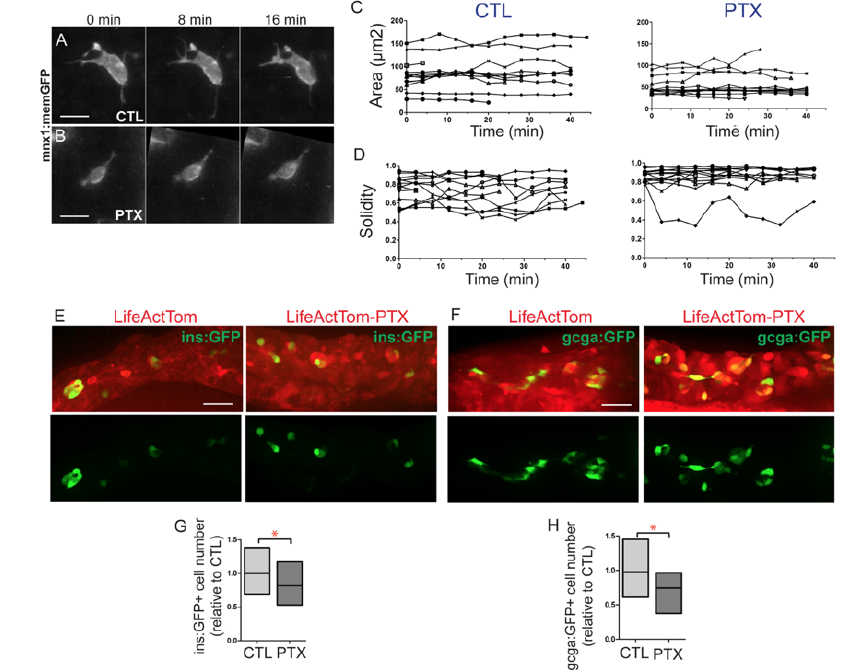
PTX expression impacts cell morphology. Related to Figure 7.
(A, B) Selected confocal projections, containing single cells, from time lapse series of control (A, CTL) and PTX expressing (B, PTX) transgenic larvae at 7 dpf, 4 or more hours following a heat shock. (C, D) For treated cells as in (A) and (B), morphology parameters of area (C), and solidity (D) plotted for each cell versus time (x-axis). (Samples as analyzed in Fig. 7F, G, Table S5 contains details of cells analyzed.) (E, F) Hormone-positive cells indicated by expression of ins:GFP (E) and gcga:GFP (F) transgenes in LifeActTom-expressing control, and LifeActTom-PTX induced samples, treated as in Fig. 7B. (G, H) Quantitation of cell number, expressed in relation to the controls. Box plot graphs maximum to minimum, line at mean. *p<0.05, t-test. (G) CTL, n=26; PTX, n=11; (H) CTL, n=12; PTX, n=12. Samples are combined from 2 independent experiments.