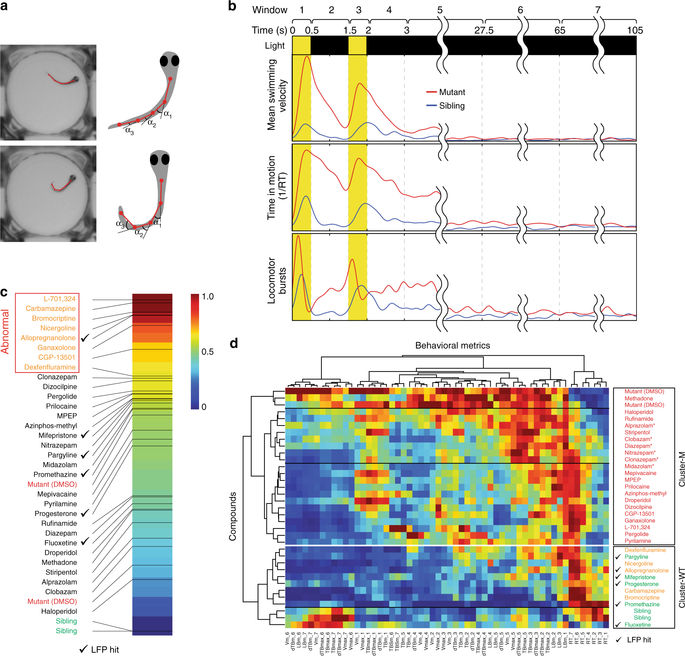
Fig. 4
Deep behavioral phenotyping. a Automated image processing algorithms are used to locate the head and multiple points along the midline axis of the tail for each larva. Behavioral metrics are calculated based on these landmarks. b Seven temporal windows are defined relative to the onset of the seizure-inducing light stimulus: (1) first light pulse (0?0.5?s), (2) inter-pulse interval (0.5?1.5?s), (3) second light pulse (1.5?2?s), (4) early post-pulse 1 (2?3?s), (5) early post-pulse 2 (3?27.5?s), (6) early interictal (27.5?65?s), and (7) late interictal (65?105?s). Eight behavioral metrics are calculated using 40+ data points (n?=?10+ larvae, each subjected to four independent light stimuli) per metric over all seven temporal intervals. Representative examples are shown for mean swimming velocity (Vm), locomotor bursts (Burstm), and time spent in motion (RT) in untreated (1% DMSO) scn1lab mutants (red) and sibling controls (blue). c Behavioral fingerprints ranked based on Euclidean distance from sibling controls (green) during interictal periods (temporal windows 6 and 7). Compounds in the upper quartile (furthest from siblings) are presumed to have adverse side-effects on resting state behavior and are designated abnormal (orange text). Mutants are indicated in red text; hits based on LFP analysis are indicated by check marks. d A 56-component behavioral fingerprints are generated for each compound based on all eight behavioral metrics during all seven temporal windows. Each square represents the average value for that feature. Compounds and behavioral fingerprints are analyzed by hierarchical clustering to identify groups that produce similar behavioral outcomes. Cluster-M contains compounds with behavioral profiles similar to untreated mutants (red text) and Cluster-WT contains compounds with profiles similar to wild-type sibling controls (green text). Compounds in Cluster-WT that cause substantial alterations in resting state behavior (temporal windows 6 and 7) are indicated in orange text. Benzodiazepines are indicated with asterisk (*), hits based on LFP analysis are indicated by check marks

