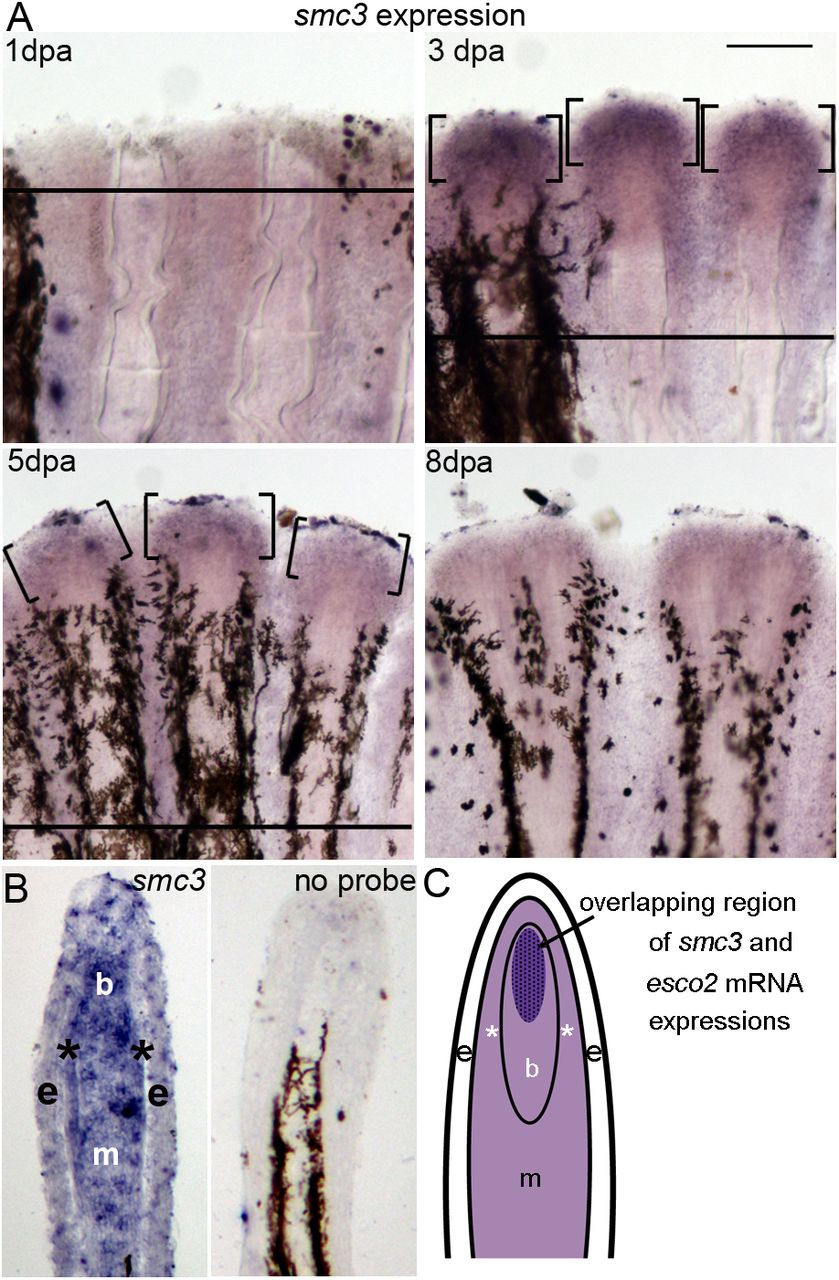
Fig. 1
Expression of smc3 in whole-mount and cryosectioned regenerating fins. (A) Expression of smc3 by whole-mount in situ hybridization at various time points (1, 3, 5 and 8 dpa) (n=6 per timepoint). A solid line indicates the amputation plane, except in 8 dpa, where it is out of the field of view. Brackets identify regions of smc3 expression. Scale bar: 50 µm. (B) In situ hybridization on a longitudinal cryosection of a 3 dpa fin showing the tissue-specific localization of smc3 mRNA. Expression is observed in most compartments of the regenerating fin, and appears to be localized strongly in the blastemal compartment (b) with moderate expression in the epidermis (e) and proximal mesenchyme (m), including the skeletal precursor cells (*). The no probe control (right panel) shows no expression of smc3. Melanocytes are observed in the lateral mesenchyme. The amputation plane is out of the field of view. Three independent trials were performed with different fin sections from three different fins. (C) Schematic representation of a longitudinal section of a 3 dpa regenerating fin showing the overlapping expression patterns of esco2 and smc3 mRNA. Lighter purple areas indicate regions of smc3 expression and the dark purple area represents both, smc3 and esco2 expression.

