
|
Fig. S5
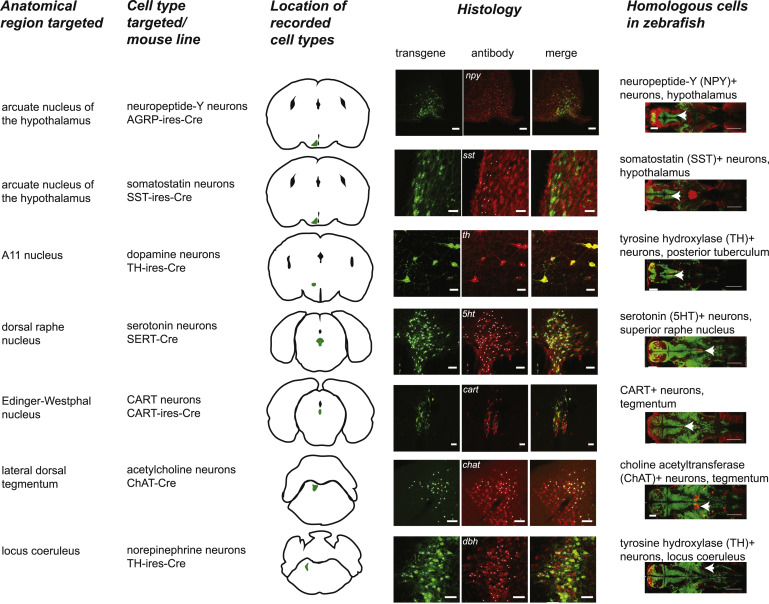
Anatomical and Targeting Details of the Seven Neuromodulatory Groups Tested in Mice, Related to Figures 5 and 6
From left: name of anatomical region targeted, name of cell type targeted and Cre line used, schematic of recording location (GCaMP-expressing region shaded in green), co-labeling of antibody label with GCaMP, ChR2-eYFP, or eNpHR3.0-eYFP expression (matching cells denoted by white dots), and homologous neuromodulatory group in larval zebrafish (from Figure S3 and STAR Methods). Scale bars: 50 μm (arcuate nucleus - npy), 20 μm (arcuate nucleus - sst), 20 μm (A11), 50 μm (dorsal raphe), 50 μm (Edinger-Westphal nucleus), 50 μm (locus coeruleus), 100 μm (lateral dorsal tegmentum), 100 μm (zebrafish images).
Reprinted from Cell, 171(6), Lovett-Barron, M., Andalman, A.S., Allen, W.E., Vesuna, S., Kauvar, I., Burns, V.M., Deisseroth, K., Ancestral Circuits for the Coordinated Modulation of Brain State, 1411-1423.e17, Copyright (2017) with permission from Elsevier. Full text @ Cell