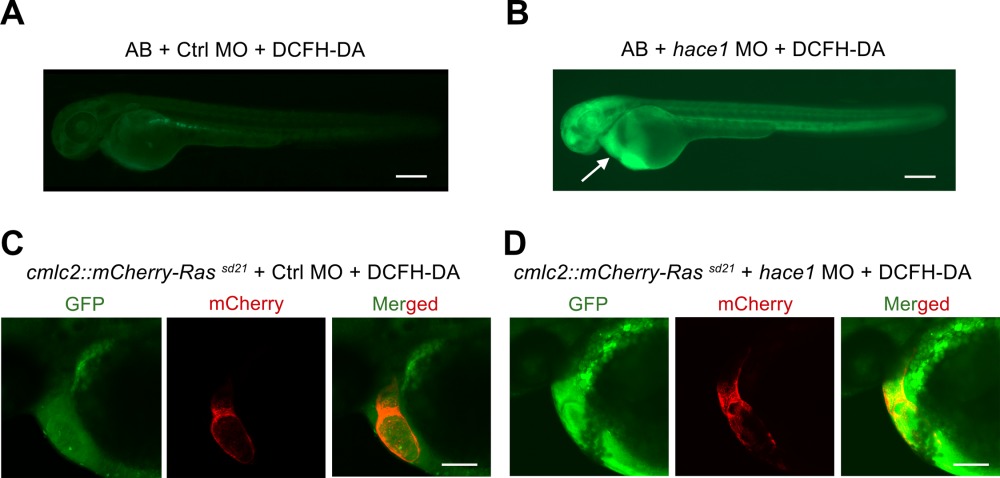
Fig. 4 ROS levels are elevated throughout the embryo and in particular in the heart following hace1 knockdown. ROS is labeled by green fluorescence generated with oxidation of 2',7'? DCFH?DA. A: AB embryos injected with control morpholino demonstrate baseline levels of ROS in the whole organism. B: AB embryo following hace1 knockdown exhibits elevated levels of ROS throughout the embryo, in particular in cardiac structures (indicated by the white arrow). Scale bar?=?250?Ám for panels A and B. C: Confocal imaging of Tg(cmlc2::mCherry?Ras)sd21 embryo injected with control morpholino demonstrates a normal two?chamber heart in red with baseline levels of ROS. D: Confocal imaging of Tg(cmlc2::mCherry?Ras)sd21 embryo injected with hace1 morpholino demonstrates a cardiac?looping phenotype and accumulation of ROS in the heart. Scale bar?=?100?Ám for panels C and D. All embryos are 48 hpf and visualized laterally.
Image
Figure Caption
Figure Data
Acknowledgments
This image is the copyrighted work of the attributed author or publisher, and
ZFIN has permission only to display this image to its users.
Additional permissions should be obtained from the applicable author or publisher of the image.
Full text @ Dev. Dyn.

