Fig. 4
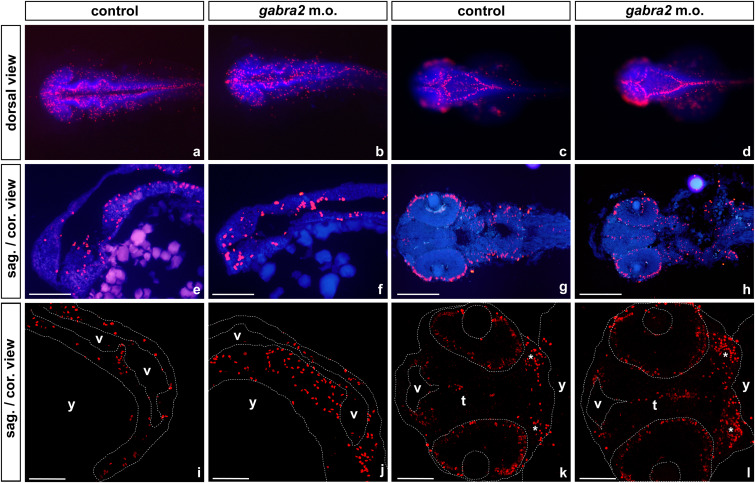
Proliferation studies on gabra2 deficient embryos. Phospho-histone 3 (Ser10) immunostaining [23] on zebrafish control embryos and on embryos that were microinjected with gabra2 morpholino. In all cases embryos are oriented with the anterior towards the left and in (a?h) cell nuclei were counterstained with DAPI (blue). (a?d) Images from wholemount immunostainings that were taken with a Leica M165FC Stereomicroscope a and b) Wholemount embryos of 24 hpf, where it can be seen that proliferation pattern in the periventricular areas of the brain is disrupted in the morphant embryos. (c and d) At 48 hpf, the proliferative pattern is mainly restored, although the labelling for the mitotic marker is increased in the periventricular areas of the mid- and hindbrain from morpholino-injected embryos. (e?h) Images from 14 ?m thick cryosections that were taken with an Olympus AX70 fluorescence microscope. (e and f) sagittal views of the fore- and midbrain from embryos of 24 hpf; in control embryos, positive cells are scattered throughout the ventral area of the brain, while mitotic cells show a more anterior and dorsal location in the morphant. (g and h) coronal sections from embryos of 48 hpf; proliferative cells are found along the midline of the tegmentum and in the outermost external cell layer of the retina in the morpholino-injected embryos, whereas control embryos display a more restricted pattern of proliferation in the CNS. (i?l) Higher resolution images of 14 ?m thick cryosections taken with a Leica confocal microscope. The periphery of the embryos, the eyes, lens, ventricles and yolk are outlined with dashed lines. (i and j) mid-sagittal section of the hindbrain from embryos of 24 hpf, where it can be observed a dense distribution of positive cells along the wall of the ventricle in the morphant embryo. (k and l) coronal section of the developing brain at 48 hpf. The gabra2 deficient embryos display more labelled cells in the midline of the tegmentum and in the gill arches than controls. Labels: t: tegmentum; v: ventricle; y: yolk: *: gill arches. Scale bars: e and f: 200 ?m; g and h: 100 ?m; (i?l): 75 ?m.

