
|
Fig. s4
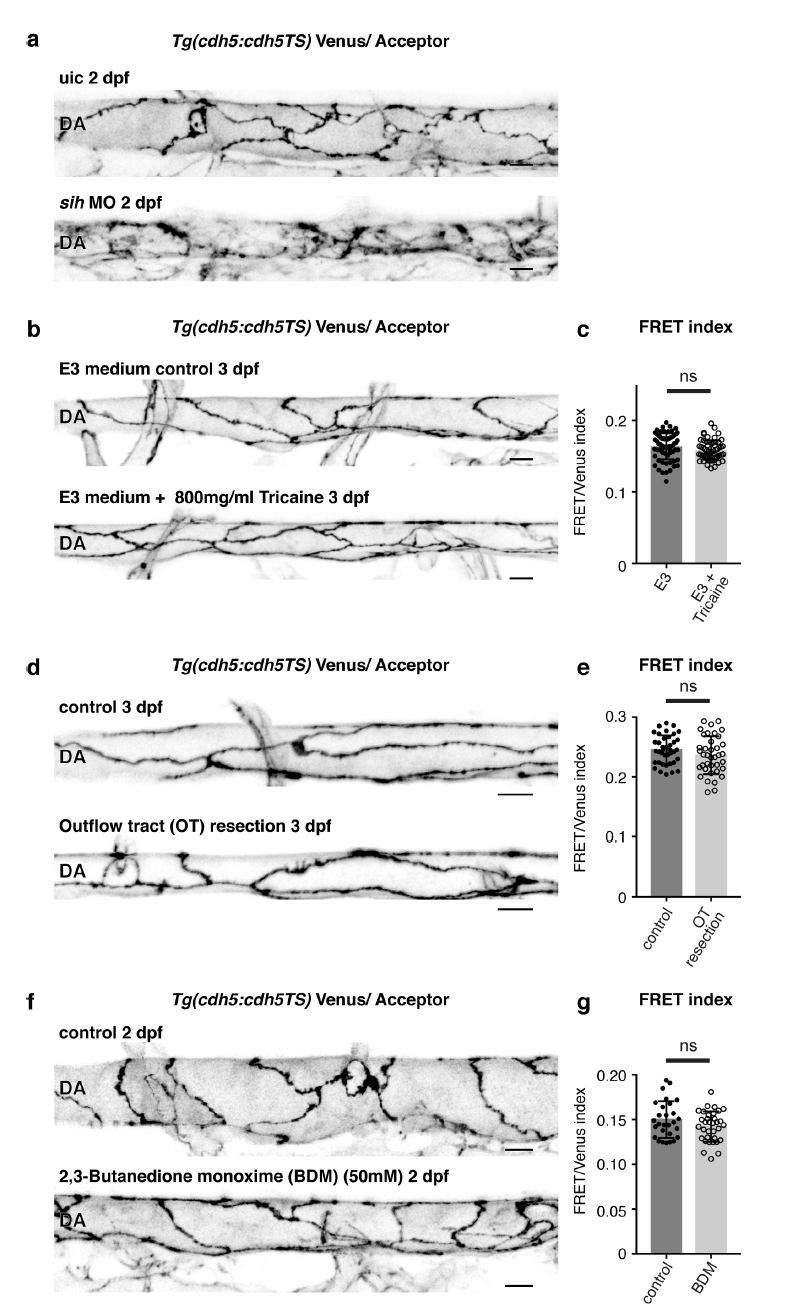
Acute loss of blood flow does not inflict immediate changes in tension across VE-cadherin (a) Junctional morphology of ECs in the DA (Venus, grey) of an uic and a sih MO injected embryo at 2 dpf showing that mature junctions fail to form without flow. Scale bar = 10?m. (b) Morphology of junctions in the DA (Venus, grey) of a control embryo and an embryo that has been incubated in a high dose of Tricaine (800mg/ml) to stop cardiac contraction and blood flow. Scale bar = 10?m. (c) Ratio-metric FRET values in junctions of control (n=68 junctional ROIs from n=10 embryos) versus Tricaine treated embryos control (n=56 junctional ROIs from n=10 embryos). Error bars represent mean � s.d.; not significant (ns) p=0.0834, from unpaired two-sided ttest. (d) Venus expression (grey) showing junctional morphology of ECs in the DA at 3 dpf of a control embryo and an embryo that underwent surgical outflow tract resection to stop blood flow. Image taken 3 hours after surgery. Scale bar = 10?m. (e) Ratio-metric FRET quantifications from control embryos (n=39 junctional ROIs from n=8 embryos) and embryos in which the outflow tract was surgically disconnected (n=38 junctional ROIs from n=7 embryos). Error bars represent mean � s.d.; not significant (ns) p=0.01472, from unpaired two-sided t-test. (f) Morphology of junctions in the DA (Venus, grey) of an untreated control versus a 2,3- butanedione monoxime (BDM, 50mM) treated embryo at 2 dpf. Scale bar = 10?m. (g) Ratio-metric FRET quantifications from junctions in untreated embryos (n=28 junctional ROIs from n=8 embryos) versus junctions in BDM (50mM) treated embryos (n=34 junctional ROIs from n=8 embryos) at 2 dpf. Error bars represent mean � s.d.; not significant (ns) p=0.1039, from unpaired two-sided t-test.