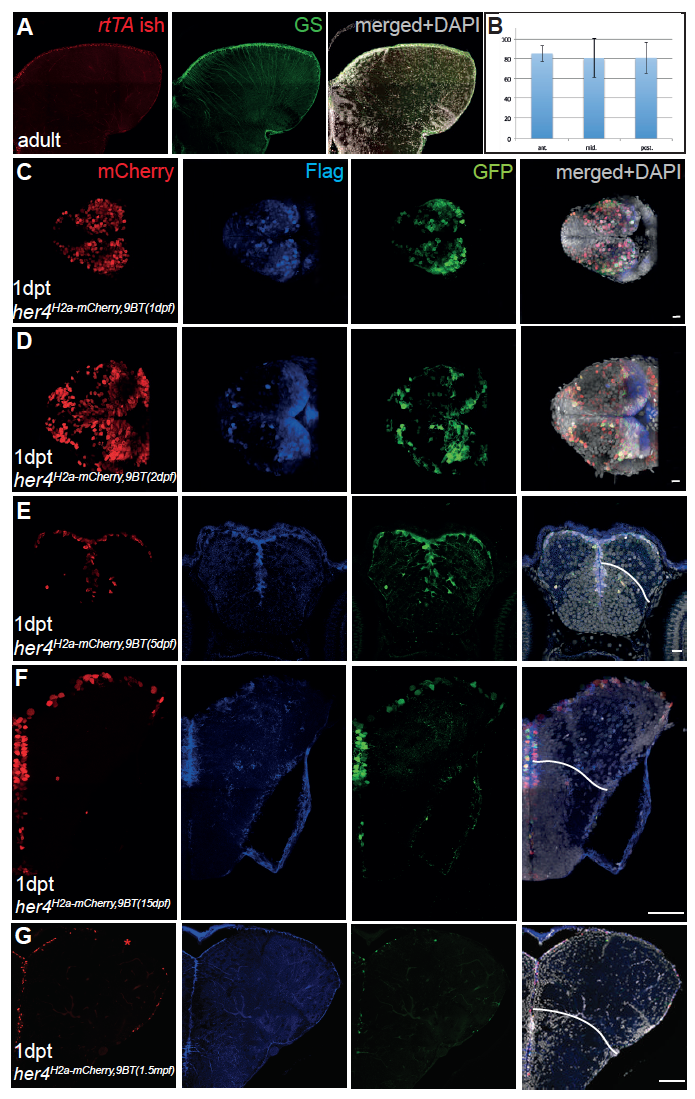
Fig. s3
Validation of the Tet-on strategy, related to Fig.2. A. Compared expression of rtTA (in situ hybridization) and GS (immunocytochemistry) (color-coded, as indicated) on cross sections of the adult pallium in a Tg(her4:rtTA) fish (one hemisphere is shown, observed inconfocal microscopy). Note that rtTA and GS are expressed in the same set of ventricular RG. B. Proportion of mCherry-positive cells among ventricular cells at three different anteroposterior levels in her4H2a-mCherry, 9TB(5dpf) fish analyzed at 1 day-post-treatment (1dpt) (n=3 brains, T-test (?=0.05, not significant). C. Compared expression of the three reporters mCherry, Flag and GFP (immunocytochemistry, color-coded as indicated) observed in whole-mount pallia (C, D) or pallial cross sections at mid-anteroposterior levels (E-G) in double transgenic Tg(her4:rtTA);Tg(GFP:biTRE:H2amCHERRY) fish induced with 9TB at 1dpf (C), 2dpf (D), 5dpf (E), 15dpf (F) and 1.5mpf (G) and sacrificed 1 day post-treatment (1dpt). Note the largely coincident expression of the three markers, the broader expression of mCherry being explained by the stability of the H2a-mCherry protein. Note also that, while her4-driven expression is limited to the pallial VZ until 5dpf (C-E), it extends to the subpallium at later stages (F, G). The red asterisk in panel G underlies a territory of the Dl VZ with low induction response at late stages (1.5mpf). The white line in E-G, right panels, indicates the pallial-subpallial boundary. Scale bars: C-E: 10?m; F, G: 50?m.

