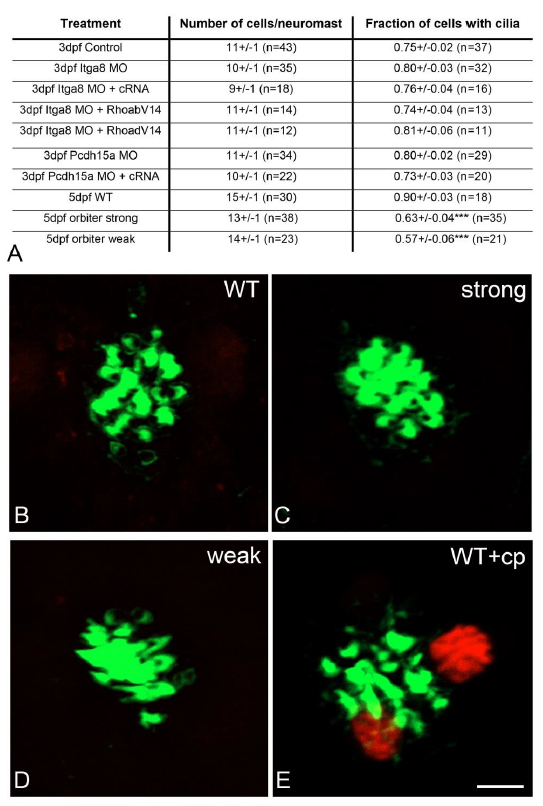
Fig. s2 Hair cell analysis in the MO and mutant animals. A: Number of cells per neuromast and the fraction of cells carrying cilium were quantified for each of the treatments (mean±SEM). One-way ANOVA followed by Dunnett’s multiple comparisons test was performed to compare number of cells per neuromast. Nonparametric Kruskal- Wallis test followed by Dunn’s multiple comparisons test was used to compare the proportion of ciliated hair cells. n: number of neuromast inspected from at least 3 independent experiments. ***p<0.001 versus WT. B-E: TUNEL labeling (red) of WT and orbiter neuromasts. Phalloidin (green) counterstained the hair cell bundle. WT+cp: Positive control: WT fish incubated with cisplatin. Scale: 4m.
Image
Figure Caption
Acknowledgments
This image is the copyrighted work of the attributed author or publisher, and
ZFIN has permission only to display this image to its users.
Additional permissions should be obtained from the applicable author or publisher of the image.
Full text @ J. Cell Sci.

