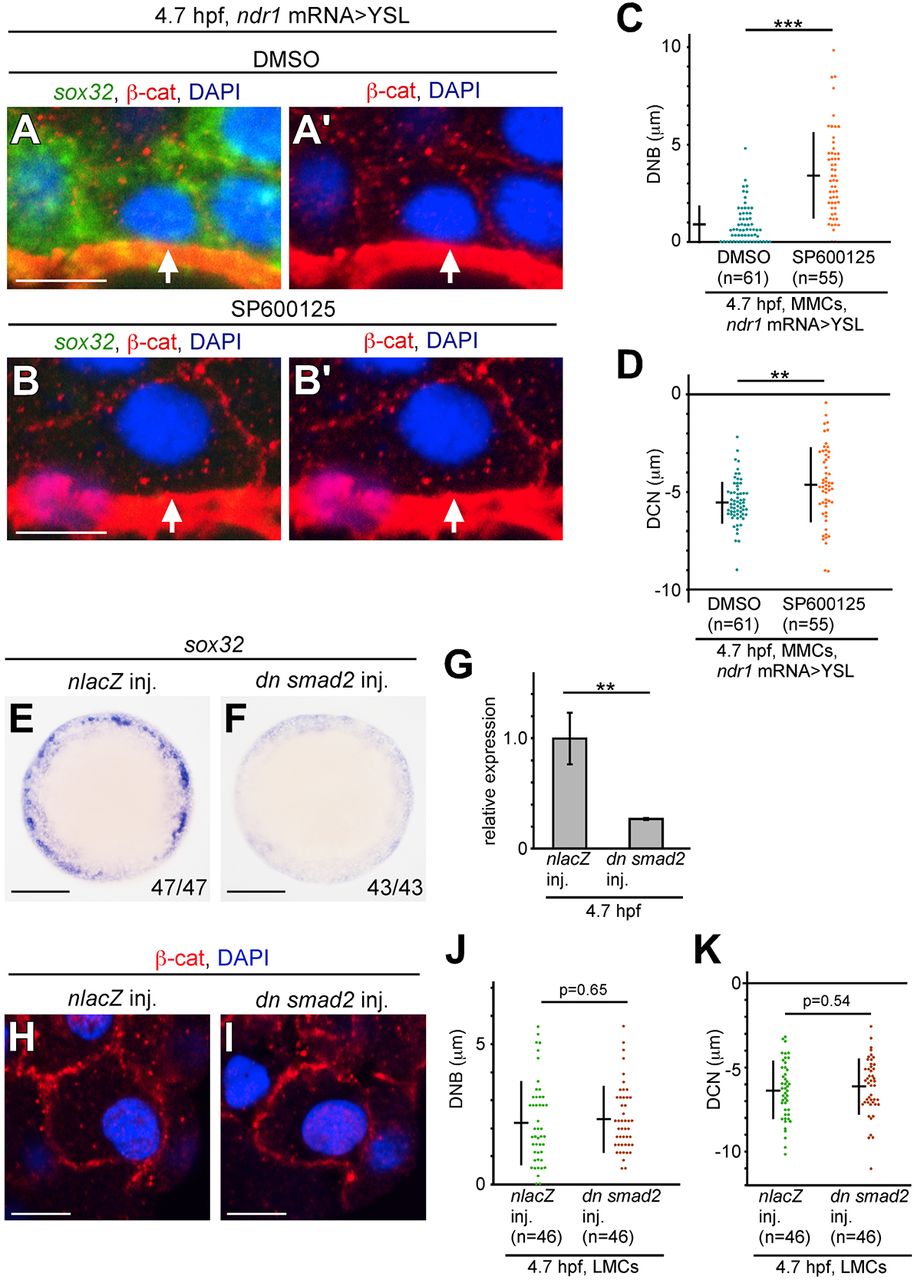
Fig. 7 Nuclear movement is regulated by non-Smad JNK signaling independent of Smad signaling. (A-B?) Transverse sections of ndr1 mRNA>YSL embryos treated with DMSO as control (A,A?) and SP600125 (B,B?); the cell membrane, nucleus and sox32 mRNA were visualized by ?-cat staining, DAPI staining and FISH, respectively at 4.7?hpf. Arrows indicate nuclei in MMCs. (C,D) Mean DNB and DCN values in MMCs of ndr1 mRNA>YSL embryos treated with SP600125 or DMSO at 4.7?hpf. n, number of nuclei examined. ***P<0.001, **P<0.05. (E,F) WISH of sox32 expression in nlacZ or dn smad2 mRNA-overexpressing embryos at 5.3?hpf. The number of embryos is shown bottom right. Animal pole views. (G) sox32 expression in nlacZ or dn smad2 mRNA-overexpressing embryos at 5.3?hpf measured by qPCR. Expression level of nlacZ-overexpressing embryos is set as 1.0. **P<0.05. Error bars represent s.d. of three independent experiments. (H,I) Transverse sections of nlacZ- and dn smad2-overexpressing embryos; the cell membrane and nuclei were visualized by ?-cat and DAPI staining, respectively at 4.7?hpf. (J,K) DNB and DNC in LMCs were measured in nlacZ- and dn smad2-overexpressing embryos at 4.7?hpf. n, number of nuclei examined. Scale bars: 10?Ám in A-B?,H,I; 200?Ám in E,F.
Image
Figure Caption
Acknowledgments
This image is the copyrighted work of the attributed author or publisher, and
ZFIN has permission only to display this image to its users.
Additional permissions should be obtained from the applicable author or publisher of the image.
Full text @ Development

