Image
Figure Caption
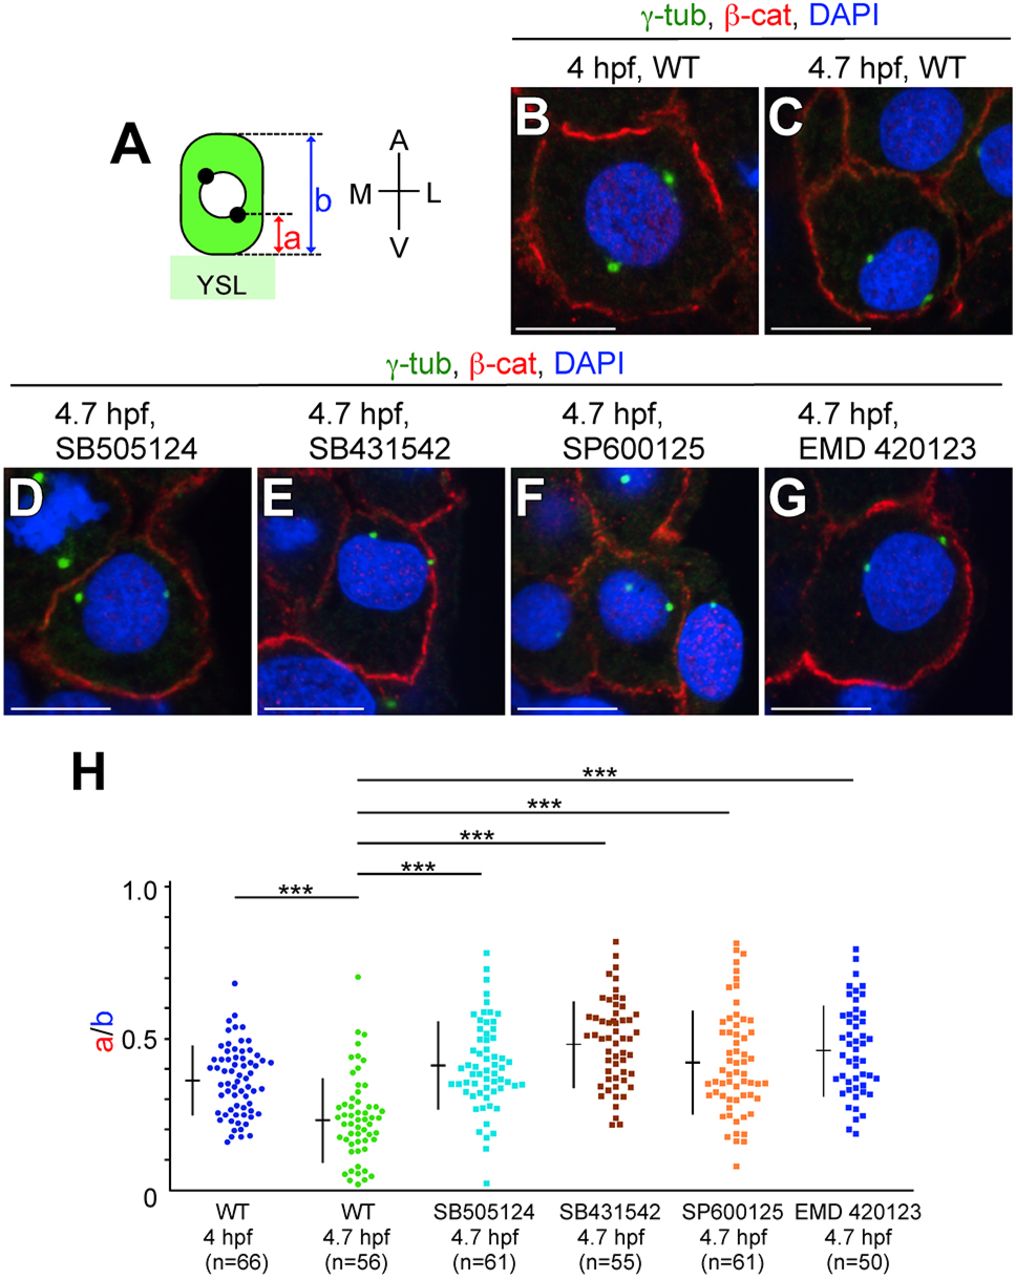
Fig. 4 MTOC reorientation in LMCs is regulated by Nodal/JNK signaling. (A) Illustration of MTOC positioning (black dots) in LMCs. a, the minimum distance between the most vegetal position of MTOCs and the blastoderm/YSL boundary; b, length of the LMC. (B-G) Transverse sections of WT and of embryos treated with SB505124, SB431542, SP600125 or EMD 420123. MTOCs, cell membrane and nuclei are visualized by ?-tub, ?-cat and DAPI staining, respectively at 4.0 and/or 4.7?hpf. Scale bars: 10?Ám. (H) a/b ratio in WT and inhibitor-treated embryos at 4.0 or 4.7?hpf. n, number of nuclei examined. ***P<0.001.
Acknowledgments
This image is the copyrighted work of the attributed author or publisher, and
ZFIN has permission only to display this image to its users.
Additional permissions should be obtained from the applicable author or publisher of the image.
Full text @ Development

