
|
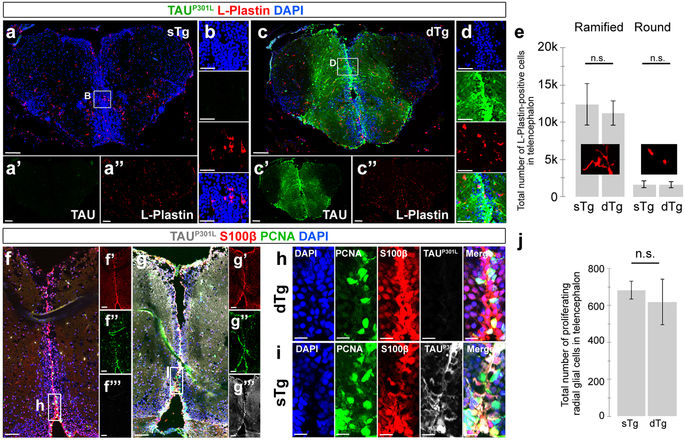
Fig. 2
(a) Immunohistochemistry (IHC) for L-Plastin (red) and TAUP301L (green) on coronal sections of telencephalon of a 6 month-old sTg animal. Single channel images of the whole section for TAUP301L (a?) and L-Plastin (a?). (b) The enlarged view of the inset in a. (c) IHC for L-Plastin (red) and TAUP301L (green) on coronal sections of telencephalon of a 6-month old dTg animal. Single channel images of the whole section for TAUP301L (c?) and L-Plastin (c?). (d) The enlarged view of the inset in c. (e) Quantification of round and ramified L-Plastin-positive cells in the telencephalon in sTg and dTg animals. (f) Immunohistochemistry (IHC) for S100? (red), PCNA (green) and TAUP301L (white) on coronal sections of telencephalon of a 6-month old sTg animal. Single channel images of the whole section for S100? (F?), PCNA (f?), and TAUP301L (f??). (g) IHC for S100? (red), PCNA (green) and TAUP301L (white) on coronal sections of telencephalon of a 6-month old dTg animal. Single channel images of the whole section for S100? (g?), PCNA (g?), and TAUP301L (g??). (h) The enlarged view of the inset in f. (i) The enlarged view of the inset in g. (j) Quantification of the total number of proliferating glial cells in the telencephalon of sTg and dTg animals. Values represent mean?�?s.e.m. *p?<?0.05, **p?<?0.01, ***p?<?0.005. Scale bars equal 50 ?m (a?g??) and 20 ?m (h,i). n?=?7 fish and?>?30 histological sections for every staining. All animals are 6 months old.